Using benchmarking tools to assist in determining objective policy limits and deductibles
Serious baseball fans were fascinated by Michael Lewis’ 2003 book titled “Moneyball” that advanced the theory that at least one prominent major league baseball team had utilized statistical analysis of opponents to its advantage in planning individual game strategy. In fact, the book’s subtitle was “The art of winning an unfair game.” Serious practitioners of liability insurance would do well to adopt some similar statistical approaches to “predicting” appropriate insurance policy limits and retention amounts, based upon averages and norms of other organizations, for the same types of insurance coverage.
This article will explore the relatively new concept of benchmarking: what it is; from where the numbers are derived; and the value of using objective sources of such information to any given organization over a period of time.
The value of benchmarking
Measurement of one’s self to norms or standards is not new. But the objective approach to benchmarking as it relates to liability insurance, and effective utilization by insurance buyers is still fairly new.
The Watson Wyatt Directors & Officers Survey, which is now known as the Tillinghast Towers Perrin D&O Survey, is universally regarded as an excellent source of information on D&O liability insurance buying trends, and its annual release is eagerly anticipated by many risk managers, insurance agents/brokers and underwriters. There are also several other excellent sources of benchmarking, which we will try to identify, with a focus on D&O and related coverages; errors and omissions; and “e-business” exposures and insurance solutions.
There is necessarily more credibility given to objective sources of benchmarking information, but there are many and varied non-objective benchmarking sources, each with the potential to give valuable information to the risk manager or insurance buyer. There is no substitute for experience and specialization in determining appropriate liability insurance limits and deductible/retention amounts, but there is a real value placed upon objective sources of information. In many situations, the liability insurance buyer will want at least some input of an objective nature as precursor of the decision-making process.
Decision makers, whether in the form of boards of directors, or at other levels, generally want to know that insurance coverage is maintained with responsible insurers, and is reasonably priced. Beyond the basics, there is also a curiosity of how the limits and per claim retention amounts stack up against competitors and similar-sized organizations, and the benchmarking process is a good way to demonstrate a perspective for comparison. In the end, almost no individual or entity wants to be “on the bottom,” or “less than average.” Thus, benchmarking can function as a realistic guide to limits, retentions/deductible amounts and even premiums for coverages in question.
Sources of benchmarking data
There are many and varied sources of benchmarking data, from simplistic, insurer files of limits/retention amounts effected and maintained, to industry specific averages. In its most basic form, benchmarking information is available without cost. Some of the more advanced data platforms (such as Advisen Ltd.) require an annual financial investment of several thousand dollars. Some benchmarking sources are seldom revised while others institute annual or semi-annual updating. Some benchmarking sources provide ancillary information such as “Corporate Governance Quotients” and industry-relative rankings on a variety of comparison bases. Here are some examples.
Insurer files. Almost any insurer will have good benchmarking data available, from its collective underwriting experience. However, some underwriters are more willing to share such information (anonymously, of course), than others. And due to the individual underwriting appetites (and restrictions) of insurers, this may not necessarily provide the buyer with a broad range of benchmarking information.
Peer group comparison. A great source of comparative averages is peer group information on limits, retentions and coverage aspects. There is just no substitute for a homogeneous group of exposures, and reviewing what other decision makers have determined to be individually effective. There are some pitfalls to this approach, however. While group members may be willing to discuss limits and retentions, there may be ultimate reluctance to share specifics because some (or all) may be viewed as competitors. There is also a general fear of coming into contact with anti-trust rules and regulations. But on a localized basis, referencing the limits and retentions maintained by peer group entities can be an invaluable tool for benchmarking purposes.
Survey results. Some surveys provide excellent benchmarking information on limits and retentions and some surveys even go well beyond these important parameters, providing annual premium information, as well.
An outstanding example is the bi-annual survey conducted by the American Bankers Association (ABA). The current version represents survey results obtained in 2005, and was released by the ABA in the first calendar quarter of 2006.
A bank institution of any asset size can use the ABA Survey to quickly determine how its current limits, retentions, premiums and even totality of insurance coverage purchased, compare with the composites in a wide variety of traditional insurance coverages. Costing less than $200, it is an invaluable benchmarking tool for both buyers of insurance coverages, as well as sellers.
Another example of an industry-specific survey that can be used for limits benchmarking is the periodic study done by the Insurance Committee of the National Association of Real Estate Investment Trusts (NAREIT). The current version was released earlier this year. Unlike the ABA Survey which is generally available to any entity willing to pay for the report, the NAREIT Insurance Survey results are available only to NAREIT members, from the association.
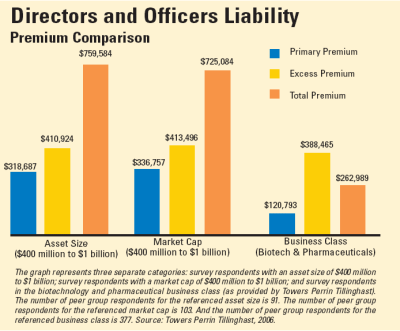
One of the oldest forms of benchmarking data is the annual Tillinghast Towers Perrin D&O Survey. Including its predecessor entity, Watson Wyatt, this survey has been providing valuable information for D&O liability insurance buyers for almost three decades, and is generally regarded as the “traditional” source of relevant information on D&O insurance limits, retentions and related information, including underwriter contacts. It’s annual release is eagerly anticipated by many buyers (as well as sellers) of D&O insurance, and the information contained therein is both interesting as well as informative for experienced persons as well as neophytes. [See chart above for a sampling of benchmarking information, based on asset size, market capitalization, and business class, from the Tillinghast Towers Perrin D&O Survey.]
Data platforms. There are several good data platforms which are available to assist liability insurance buyers with decision making.
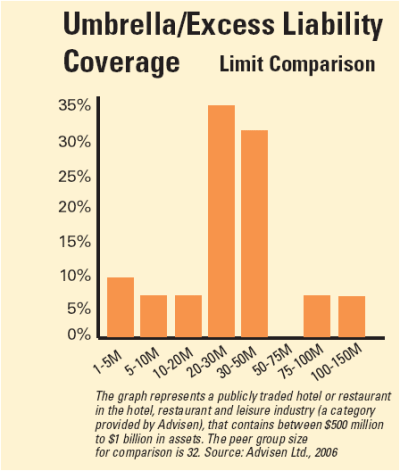
An outstanding example is the Advisen data platform, available to subscribers for an annual fee. Currently, benchmarking information is available for many lines of insurance coverage, including D&O, employment practices liability, fiduciary liability, E&O, and even umbrella liability coverages. [See chart to left, which uses Advisen benchmarking data and format to provide limits information on a publicly-traded hotel/restaurant umbrella liability limit.]
In addition to benchmarking of limits, per claim retentions and annual premiums, this resource also provides Corporate Governance Quotient ratings and information, based on several public information sources. Thus, the perceptive seller of insurance can use this resource not only to benchmark a variety of coverages, but also to impress the buyer with their in depth knowledge of comparative information (within peer groups, as well as overall) on the governance aspects of the organization.
Additionally, Advisen is a sponsor, along with the Risk Insurance Management Society, of the annual “Cost of Risk” report, which is yet another objective source of comparative information and data on limits, retentions and costs for selected industries. Arranged in online or hard copy format, the annual “Cost of Risk Survey” provides the buyer with a multi-category picture of limits and retention amounts maintained by various industry classifications.
Potential problems with benchmarking
On the surface, there would seem to be little downside to using benchmarking data. The information available (especially that information which would be considered “objective”) would seem to be almost invaluable in assisting insurance buying decision-makers with acquiring appropriate limits, as well as retention or per claim deductible amounts, and under even the worst of circumstances, the guidelines provided are considered reasonably solid information. However, many (career) students of insurance cite some potential negative issues with an over reliance on benchmarking information.
Many data bases (formal or informal) may not contain enough limits or other benchmarking data to make them fully, or even partially, credible. Some organizations which compile and distribute benchmarking data do not a have a wide spread of categories for which to properly classify the data.
Relying solely on benchmarking data to establish limits, retention or deductible amounts can ignore other factors which could make claims more likely such as deteriorating financial condition in a D&O liability situation, or an organization which is the largest within its peer group.
Some benchmarking data requires a significant time frame for accumulation and analysis, and the resulting “report” or data base has become partially or totally outdated.
Overall good approach
But overall, benchmarking can provide insurance buyers and sellers with an attractive approach to establishing relative, if not generally appropriate limits, retention (or per claim deductible) amounts, or even premiums for various liability coverages. Benchmarking should at least be heavily considered, and if the benchmarking source is considered relevant, then some reliance may be made upon the information.
A prudent insurance broker who is providing benchmarking information would be well advised to document that the benchmarking data is just a guide, and not an absolute reference to the value of the information. And benchmarking certainly beats “a shot in the dark” at projecting limits and retention amounts. If “averages” and “norms” are to be taken seriously then benchmarking can be a valuable tool. It’s just one more way in which a prudent insurance broker can assist the client in securing responsive insurance coverage.
Richard Clarke is senior vice president of Georgia-based J. Smith Lanier & Co., a member of the RiskProNet agency network. He has published numerous articles on a variety of executive liability and E&O subjects. Sam Stern joined J. Smith Lanier’s Executive Protection team in April 2006.
Topics Directors Officers
Was this article valuable?
Here are more articles you may enjoy.


 Employers Can’t Use Vicarious Liability to Block Negligence Claims, TN High Court Says
  Pennsylvania Issues Its ‘Expectations’ for Insurance Carriers Regarding Their Use of AI
  Soaring Insurance Costs Hit as US Buyers Finally Get a Break on Car Prices
  Florida Peninsula Says Reforms Have Had an Impact, Announces 2% Rate Cut


