

This post is part of a series sponsored by CoreLogic.
Though the COVID-19 pandemic is occupying most of our attention at the moment, hurricane season has begun and natural catastrophes never take a holiday. Forecasts for 2020 have projected higher than average hurricane activity, implying higher levels of devastating storm surge.
On August 26, Hurricane Laura made landfall along the Louisiana coast as a category 4 storm with maximum sustained winds of 150 miles per hour. This made Laura the most intense hurricane to make landfall in the northwest Gulf Coast since 1856.
CoreLogic analysis indicates that over 626,000 homes were exposed to tropical storm force or higher strength winds from the hurricane. While this event was not as devastating as it could have been, it was a significant impact to those in the immediate path of the storm.
Heading into hurricane season, the prospect of confronting a large natural catastrophe like a hurricane or flood during the coronavirus crisis may seem daunting. But using modern data and analytics technology that combines hurricane models with property characteristics and building codes can make us more resilient, even during these uncertain times.
How Experts Forecasted This Season’s Severity
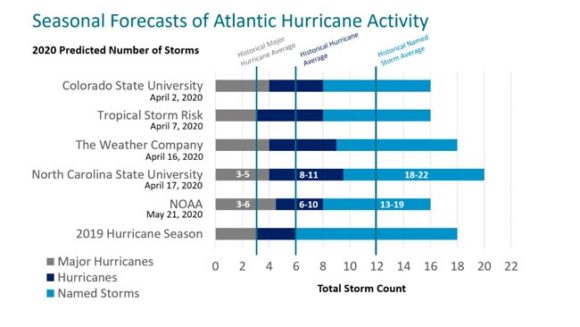
Every year, a variety of institutions make their own predictions of the season’s hurricane frequency and severity. There are several factors these forecasts consider – the most significant of which are sea surface temperatures and the state of the El Niño Southern Oscillation.
Sea Surface Temperature
Hurricanes are fueled by the evaporation of warm seawater into the lower atmosphere. With higher water temperatures, there will be more evaporation and, thus, more energy present in the atmosphere. This higher energy contributes to longer and more severe hurricane systems.
Data indicates that sea surface temperatures are higher than normal. This is particularly true in the tropics, the main development region of Atlantic hurricanes.
El Niño Southern Oscillation
The El Niño Southern Oscillation (ENSO) describes year-to-year variations in sea-surface temperatures, rainfall, air pressure and atmospheric circulation that occur across the equatorial Pacific Ocean. There are two phases in ENSO – the warm phase, El Niño, and the cool phase, La Niña.
La Niña is typically associated with an increase in hurricane activity due to lower wind shear in the tropics. Most models predicted that this year would be moving into neutral conditions, while some of them went further and predicted weak La Niña conditions.
Source: CoreLogic, Inc. © 2020 CoreLogic,Inc., All rights reserved.
Forecasts for the 2020 season predicted around four major hurricanes, eight total hurricanes and 16 named hurricanes. This prediction is significantly higher than the historical averages of roughly three major hurricanes, six total hurricanes and 12 named storms every year. Higher surface sea temperatures and neutral or La Niña conditions could mean above average activity this hurricane season.
More Hurricanes Mean More Storm Surge
Storm surge is the rising of the sea as a result of the wind and pressure associated with a hurricane. Once a hurricane makes landfall, the mass of water in front of the moving storm hits the coastline and moves inland. This surge of water and wind poses a tremendous risk to life and property. The Hurricane Katrina storm surge in 2005 extended about six miles inland at maximum heights approaching 27 feet, and the phenomenon has prompted discussion on the threats posed by severe storm systems.
One of the biggest issues with storm surge is that it is often combined with simultaneous onshore precipitation. This means that while there is a mass of water from the hurricane moving inland, there is also a mass of water piling up from precipitation-based flooding that normally would be dissipated down streams and rivers towards the ocean. Consequently, storm surge exacerbates an already drastic flooding situation.
In order to quantify the risk storm surge poses, one must account for the structure of the land mass itself. This includes factors like a property’s elevation, distance from the coast and barriers like roadbeds or levees. Possible impact damage caused by debris from buildings, tree limbs or vehicles should also be accounted.
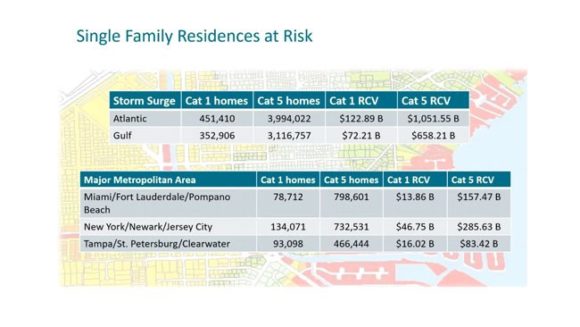
Figure 3: Single Family Residences At Risk
Source: CoreLogic, Inc.© 2020 CoreLogic,Inc., All rights reserved.
By combining these factors, CoreLogic can create an inventory of all the homes that will experience damage from surge and calculate the reconstruction value in a region.
One of the limitations of modeling risk from storm surge is that without knowing the specific details of the individual storm, one must assume 100% loss for each property. With this assumption, it can be estimated that the top three metropolitan areas with the most potential damage to a number of homes are the Miami, New York, and Tampa metros. For more information on how to quantify storm surge risk, download the CoreLogic 2020 Storm Surge Report.
Local Building Codes Determine Risk
Building codes are the primary determinant of a building’s resilience to natural hazards. These codes influence all aspects of a structure, including the design of the roof, windows and doors. Within a state, building regulations will often vary by region.
Florida, a state known for its routine susceptibility to hurricane damage, has unique design standards for specific areas. Some regional regulations are considerate of high velocity debris zones, thus, assisting in reducing damage from flying debris. But while building codes are constantly improving over time, many communities are not rebuilding. This means many older communities are still at significantly higher risk of damage.
The damage of a home is often directly related to the wind speed at the site. Lower windspeeds often cause roof damage correlated with roof materials, roof age, eaves and parapets. Higher windspeeds often cause more extensive structural damage correlated with window glazing and roof diaphragm connections.
CoreLogic Using Local Building Codes To Estimate Claims
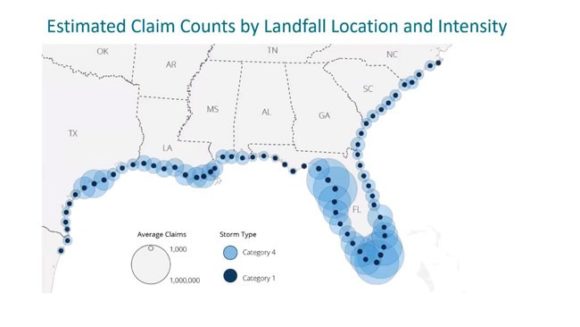
By leveraging CoreLogic data to determine locations of all properties in a region, we can create a probabilistic model that runs a suite of all intensities of hurricanes along a coastline to estimate the number of potential claims. In this simulation, we plotted two sets of data: the estimated number of claims for a Category 1 hurricane and the estimated number of claims for a Category 4 hurricane.
Figure 4: Estimated Claim Counts By Landfall Location And Intensity
Source: CoreLogic, Inc. © 2020 CoreLogic,Inc., All rights reserved.
The model runs hypothetical hurricanes with varying landfall destination to estimate which landfall locations would result in the most damages. The risk of hurricane damage is very dependent upon the hurricane’s landfall destination and intensity. Across the board, Category 1 hurricanes demonstrate a consistent number of average claims regardless of landfall location. However, for Category 4 hurricanes, the landfall location plays an outsize role in the number of claims. In the South Florida Tri-County area, the number of claims for a Category 4 hurricane could reach as high as 1 million.
What’s happening now?
By accounting for the effects of storm surge and incorporating property characteristics and building codes into prediction models, communities and insurers can become more resilient in the face of hurricanes. Hurricane-exposed insurers can use these technologies to be more prepared for this year’s season.
For example, we can apply the above to today’s hurricane activity.
On September 14, Hurricane Sally was approaching the Gulf Coast. For only the second time in history, there were five active tropical cyclones in the Atlantic. The other cyclones included Hurricane Paulette, Tropical Storm Teddy, Tropical Storm Vicky, and Tropical Depression Rene.
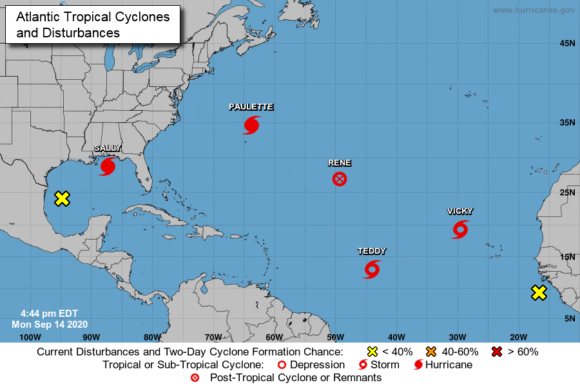
Source: National Oceanic and Atmospheric Administration
Sally made landfall the morning of September 16th near Gulf Shores, Alabama as a strong Category 2 hurricane with maximum sustained winds of 105 mph. Sally was a hurricane of moderate size with hurricane-force winds extending up to 40 miles from the center and tropical storm-force winds extending out to 125 miles. It is the 18th named storm thus far in 2020, continuing the record pace of named tropical storms to date.
Extreme rainfall in excess of 30 inches has been reported along the Gulf Coast, resulting in widespread catastrophic flash flooding with multiple streams having already risen over 15 feet. Flooding is expected to spread further inland as Sally slowly makes its way through southern Alabama and Georgia.
Sally weakened and downgraded to a Tropical Storm on the afternoon of September 16th. With a Category 2 status at landfall, Hurricane Sally could affect the following areas with the associated reconstruction cost value (RCV). RCV figures assume 100 percent destruction of all at-risk homes – and represent the worst-case scenario.
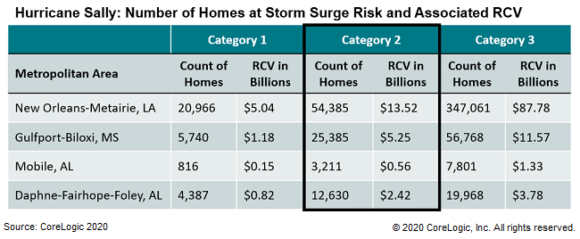
Building codes in Mississippi and Alabama are less stringent on wind resistance relative to building codes in Florida. While the building codes’ lack of focus on wind resistance will contribute to more significant wind damage in the region, most of the damage from the hurricane will be caused by flooding.
The insurance industry needs to apply analysis like this consistently across at-risk areas so insurers with hurricane-exposed portfolios can better plan to protect homeowners and run a more resilient business.
© 2020 CoreLogic, Inc. All rights reserved
Topics Trends Catastrophe Natural Disasters Property Hurricane
Was this article valuable?
Here are more articles you may enjoy.
 Former Congressman Charged After Collision with State Trooper in Florida
  South Carolina Ringleader Sentenced to 8 Years for Staged Accidents
  Marsh McLennan Agency to Buy Fisher Brown Bottrell for About $316M
  Vintage Ferrari Owners’ Favorite Mechanic Charged With Theft, Fraud