View this article online: https://www.insurancejournal.com/blogs/research-trends/2018/01/04/475902.htm
“According to CoreLogic, a leading source for flood and disaster risk data, approximately 70 percent of the flood damage from Hurricane Harvey was uninsured….” states Clearsurance in their recently released a report on results of a survey conducted to identify homeowner concerns about natural disasters. Among the 1,000 homeowners responding, a disconnect was revealed between perceived risk and adequate homeowner’s insurance.
From what I have gathered, there are a number of pockets throughout the US where the number of residential homes located in high risk zones exceeds the number of policies written by the NFIP. Does this translate into opportunity for the private market or reflect a healthy level of participation by private carriers? From the limited data, we can only conclude that these homes are currently insured privately, force placed or uninsured…does that spell opportunity? If you serve these areas, we’d love your insights, as we continue to monitor increased participation from carriers in the private flood market.
The property risk data used below has been provided by Attom Data Solutions and utilized to compare high risk residential properties in each county of the US against the number of policies written by the NFIP, as of year end 2016.
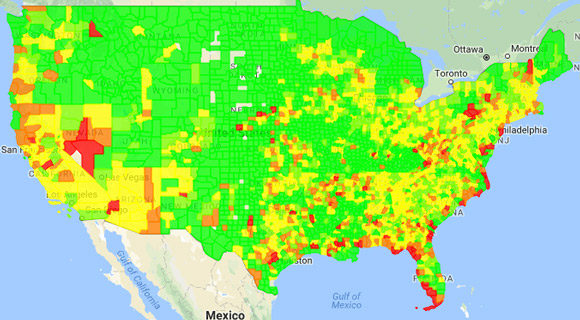
(Attom Data Flood Risk Heat Map)
The New England region is the third smallest flood insurance market, with just over 140,000 policies written by the NFIP at year end 2016. For perspective of relative flood risk and market size, the total insurance in force in this region is less than in the state of North Carolina.
In New Hampshire and Vermont, there remain a combined 1,200 homes in high risk zones that are not covered by the NFIP as of year end 2016. Though these states generally exhibit a moderate flood risk portfolio, these particular homes fall within the high risk zones.
Homes not covered by the NFIP are concentrated in New Hampshire’s Carroll County, home to water front properties along Lake Winnipesaukee, and Vermont’s Washington County, with the cross section of the Winsooski and Mad Rivers. Each of these states has relatively low participation from private carriers.
The southern region is the largest flood insurance market, with nearly 3 million policies written by the NFIP at year end 2016. Floridian properties account for 60% of the policies, with the greatest participation from private carriers of any state, though still only 12% of the market.
Arkansas has in excess of 6,800 homes in high risk areas not covered by NFIP. The most significant concentration of these homes fall within Pulaski County, home to Little Rock, the Arkansas River and numerous lakes.
Further, an estimated 35,000 homes in the state of Georgia are not covered by the NFIP. Though these are disbursed across the state, two noted concentrations include the coastal county of Glynn offering 4,000 residences and Dougherty County, with the city of Albany situated along the Flint River, offering 3,000 homes not covered by NFIP.
Based upon our review, the state of Tennessee has in excess of 32,000 homes located in high risk areas that are not covered by the NFIP. These homes are not concentrated in any one county. Rather, it appears most counties have a significant number of homes not insured by the NFIP and are of lower market value.
West Virginia’s at risk homes exceed the NFIP coverage by more than 12,000 homes with a concentration of 5,000 homes in Kanawha County, which includes Charleston and the Kanawha Rivers. Ohio County offers another 1,200 homes along the Ohio river.
The lake region falls to the middle of the flood market with 141,124 policies written at year end by the NFIP. There remains very low participation from private carriers in the residential market. Most NFIP coverage is written in the state of Illinois, accounting for 31% of the region’s portfolio.
Excluding Illinois, this region offers just over 63,500 homes in high risk areas not insured by the NFIP. Most significant are the Wayne and St. Clair Counties of Michigan, along the great lake, representing 10,400 and 5,000 homes respectively. In Ohio, Luca and Ottawa Counties offer 2,900 homes. Indiana’s Vanderburgh County, located on the Ohio river reflects an excess of 2,300 home not participating in the NFIP. Concentrations of homes in Wisconsin lake counties of Brown, Roc and Winnebago also exceed NFIP policy counts.
As the second smallest flood market, the NFIP has written a total of 82,150 policies at year end 2016. Participation by private carriers in the residential market is low and housing prices hover at or below the coverage provided by the NFIP.
The flood market is predominately insured by NFIP, with just over 5,000 homes in Iowa and Kansas not covered. Those are concentrated in Iowa along the Cedar, Missouri and Mississippi Rivers in Black Hawk, Pottawattamie and Scott Counties. A concentration of homes in Sedgwick County within the zone of the Arkansas River are also not insured by NFIP.
The Southwest region is the second largest flood market, with 90% of the 600,000 policies written by the NFIP attributed to the state of Texas. Despite its size, and over 223,000 homes located in the highest risk flood zones, there is very limited participation by admitted residential carriers. Inclusive of surplus lines, private insurance represents 37% of this market, largely commercial.
Areas underserved by NFIP are found in Oklahoma and New Mexico. Of the 14,300 homes not covered by the NFIP in New Mexico, the largest cluster of 8,900 homes is found in the flood zones of the Rio Grande in Valencia County. In Oklahoma, where 16,717 homes are not covered by NFIP, the largest concentration of homes are found in high risk areas of Oklahoma County (3,211), Tulsa County (3,310 ) and Garvin County (1,989).
This region has the smallest flood insurance market in the analysis, with just over 39,000 policies written by the NFIP at year end 2016. Colorado contains the greatest flood risk, representing 56% of NFIP’s Rocky Mountain insurance portfolio.
Only the state of Idaho reflects a portion of its high risk housing unserved by the NFIP. Of the 1,287 homes either privately insured or uninsured, the majority are located in the county of Shoshone, which is intersected by the St. Joe River.
From the above, it appears there is opportunity to serve the high risk market in-land. But as the Clearsurance report reveals, those aware of the risk, with great concern for the potential hazards, are not necessarily checking their policies or upgrading their coverage. If you have any insights to share on these markets, please leave us a comment so that we may learn more about the potential opportunities in-land.
Index Methodology
Estimate of homes not covered by the NFIP is a conservative estimate based upon the number of homes identified by ATTOM Data Solutions as located within the highest risk zones of A, A99, AE, AH, AO, V & VE. These are then compared to total policies written at year end 2016 by NFIP. Please note that 68% of the NFIP portfolio is residential but such break down is not available on a state by state basis and has not been applied to this analysis. Further, we have not included zones A1-30. “Not covered by NFIP” reflects a combination of privately insured and uninsured properties and hence, opportunity for private carriers.
For its third annual Natural Hazard Housing Index, ATTOM Data Solutions indexed more than 3,000 U.S. counties based on risk of six natural disasters: earthquakes, floods, hail, hurricane storm surge, tornadoes and wildfires. ATTOM also analyzed home sales and price trends in more than 800 counties with at least 100 single family home sales in the first six months of 2016.
A flood risk index was created for the flood risk in the 3,111 counties with natural hazard data available. The flood risk index was divided into five categories of risk: Very High, High, Moderate, Low and Very Low based on a severity scale. The maximum index for each category of risk is 60, and the maximum possible total index score is 360.
For the home sales and price trends analysis, the indexes in 804 counties with sufficient home sales and price data available were split into five equal groups (quintiles) matching the aforementioned five categories of risk.
Flood zone data is based on flood zones created by the Federal Emergency Management Agency (FEMA), and the level of risk was based on the percentage of homes in each county located in high-risk flood zones: A, A99, AE, AH, AO, V, and VE.