View this article online: https://www.insurancejournal.com/magazines/mag-closingquote/2014/10/06/342096.htm
Dr. Robert Hartwig, president of the Insurance Information Institute (III), is well known for his plentiful data on the insurance industry and chartist presentation style. His identification and aggregation of data is quite commendable.
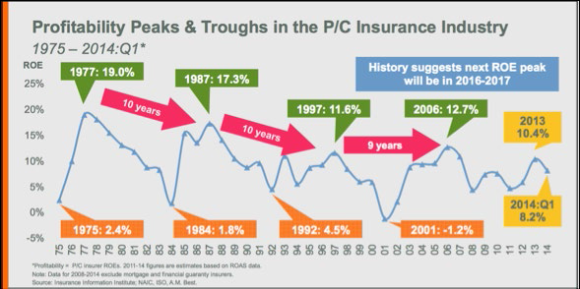
On several occasions, I have come across Dr. Hartwig’s chart on Property/Casualty Insurance Profitability (See above). The image shows annual first quarter return-on-equity (ROE) for the property/casualty industry from 1975 onward. Arrows overlaying the data demarcate an approximate 10-year period between points of peak profitability.
I don’t find the suggested decadal cycle of P/C industry profitability all that convincing. However, I do think the data is interesting.
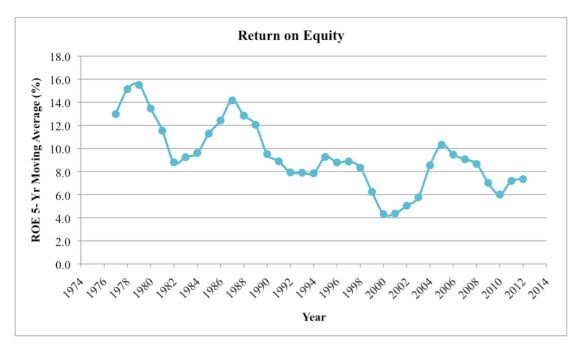
I’ve extracted the data from Dr. Hartwig’s “P/C Insurance Profitability” chart above and created the two charts below. The first chart shows the five-year moving average of the data.
Return-on-Equity as a Five-Year Moving Average
The second chart depicts the data as an index, using the overall average as the base value. The average ROE from 1975-2014 is about 9.3 percent.
Return-on-Equity Data Shown as an Index
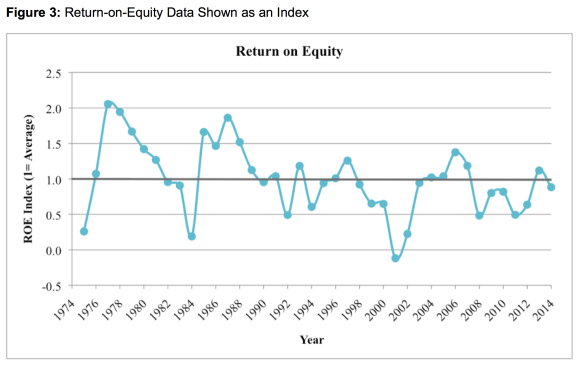
Both charts suggest a general downward trend in profitability from what were, evidently, the heydays of the late 1970s. Since the early 1990s profitability has remained fairly stable and varied by about 50 percent above or below average. The notable outlier during this time period is 2001.
Why has the ROE remained fairly stable since the early 1990s as compared to the previous 15 years?
One possible reason concerns the influence of risk modeling on the industry. Risk models such as, catastrophe models, were rapidly and widely adopted into risk decision-making in the early ’90s. The models provide a means to control industry wide perception of a given risk. Risk measures are variable but only within a certain range predetermined by industry dominant vendors. When the industry loses or gains too much, new model versions offer a scientifically valid means for the industry to alter its perspective on a risk thereby maintaining generally consistent profitability. If the models really do help explain the observed ROE data, then assuming the industry’s model-happy status quo, little reason exists to expect much to change.
So, while Dr. Hartwig suggests the next P/C insurance profitability peak will arrive in 2016-2017, his data (and perhaps some context) also suggests the peak will likely be about average.