

This article is part of a sponsored series by Cotality.
Flooding by the Numbers
A review of the annual damage resulting from floods indicates that coastal flooding, riverine flooding and also flash flood events combine to form the #1 natural disaster in the United States1. From 2005 to 2012 the National Weather Service (NWS) and National Climatic Data Center (NCDC) summarized flood damages incurred from riverine and flash flooding to be $23.7 billion dollars2. During this time, flash flooding damage is estimated to have contributed approximately 33% ($7.9 billion) of the total damage2.
New York Hits a 24-Hour Rainfall Record
Recently, over a foot of rainfall in just a few hours brought parts of Long Island, New York, to a standstill. On Wednesday, August 13 a state of emergency was declared for the town of Islip after 13.57 inches of rain fell, setting a 24-hour record for the state of New York3. The flash flooding that resulted from the storm damaged hundreds of properties and will total in the millions of dollars.
Events like this help to push flooding to the top of the list of natural disasters in the United States4. Due to the speed with which flash flooding occurs, there is little opportunity to prepare for or mitigate against it. In addition, flash flooding locations are not limited to areas in close proximity to water bodies, so property owners may not even be aware of the risk from flooding until the downpour begins.
Case Study: Flash Flood Risk Score in Bay Shore
For the Long Island flooding, CoreLogic® used Flash Flood Risk Score (FFRS) to evaluate the flood risk at the intersection at Sunrise Parkway and Fifth Avenue in Bay Shore, New York (Figure 1), which ultimately flooded as a result of heavy rain in the area. CoreLogic analysis returned a risk score of 71 (on a scale of 1-100) and a “High” risk rating for the intersection. Clearly this location is susceptible to flash flooding and as the FFRS data indicate, that potential risk was verified by the August event. Figure 2 below is an example that illustrates the impact that flash flood waters can have on urban communities.

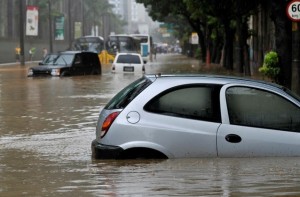
Figure 1: The FFRS subject location at Sunrise Parkway and Fifth Avenue in Bay Shore, New York along with the CoreLogic FFRS risk score and rating.
Source: CoreLogic and Google Maps 2014.
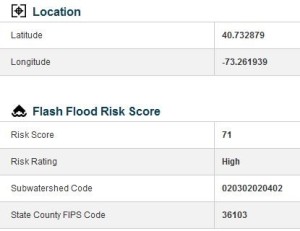
Figure 2: Flash floods result in a high risk for loss and extensive property damage.
The Right Solution for Better Coverage
Many insurers don’t realize that they are covering losses that could be more clearly understood with the right flood risk model. Whether using an aggregated or by-peril rating approach, CoreLogic can help you understand flash flood risk at the most granular level possible.
Learn More
For more information about CoreLogic Flash Flood Risk Score, click here, call us at (855) 267-7027 or email us at hazardrisk@corelogic.com.
SOURCES:
- FloodSmart.gov, 2014.
- National Weather Service, Summary of Natural Hazard Statistics in the United States from 2005-2012.
- The Weather Channel, “Long Island Flooding: Islip, New York Swamped By Over 13 Inches of Rain,” 2014.
- FloodSmart.gov, 2014.
Was this article valuable?
Here are more articles you may enjoy.
 Insurify Starts App With ChatGPT to Allow Consumers to Shop for Insurance
  Jury Finds Johnson & Johnson Liable for Cancer in Latest Talc Trial
  Fla. Commissioner Offers Major Changes to Citizens’ Commercial Clearinghouse Plan
  Munich Re Unit to Cut 1,000 Positions as AI Takes Over Jobs