
This article is part of a sponsored series by Cotality.
Recent changes in earthquake hazard science in California are transforming the way we think about managing earthquake risk. The Uniform California Earthquake Rupture Forecast (UCERF) is a multi-year project by a consortia of leading scientists known as the Working Group on California Earthquake Probabilities (WGCEP) that offers a consensus-based view of earthquake hazard across California.
The latest iteration of UCERF, version 3 (UCERF3), released in 2014 (a time-independent view of hazard1) and 2015 (a time-dependent view of hazard2) had a key objective to define the frequency and distribution of earthquakes—both on and off seismically active faults in California (see Figure 1).
Figure 1: Framework of UCERF3 Earthquake Hazard Model
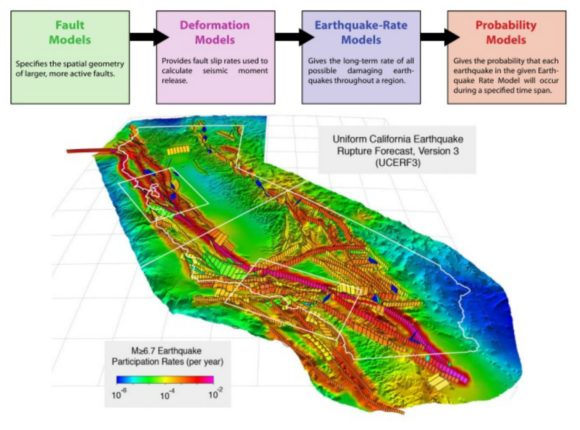
Source: Fields, et al., 2014.1
Understanding What Has Changed
While re-evaluating the magnitude-frequency distribution of earthquakes in California, the UCERF3 team of experts tried to obtain a pattern that matched more closely with the historical record, or what’s known in the seismological community as a pure Gutenberg-Richter relationship.
In the previous version of the model (UCERF2)3, the magnitude-frequency distribution deviated from a Gutenberg-Richter relationship, in particular, within the range of magnitude 6.5 to 7.5 earthquakes. There was a notable increase in the frequency of these magnitudes, forming a bulge in the magnitude-frequency distribution curve. The UCERF3 expert committee aimed to reduce this bulge in the curve, while maintaining the same total seismic moment, or total energy release, for all potential earthquakes. The only way to achieve this was to relax the fault segmentation, which means they had to allow for earthquakes to rupture on multiple segments of faults, or multiple faults, within close proximity of each other. In combination, the extra frequency of the magnitude 6.5 to 7.5 events was pushed into the two ends of the magnitude-frequency distribution curve, thereby increasing the frequencies of both larger and smaller earthquakes.
From an earthquake hazard perspective, the increase in rupture lengths and larger magnitudes has resulted in earthquakes with both longer rupture areas and larger footprints of damage (see Figure 2) in California than what the previous UCERF2 model indicated. In particular, the San Andreas fault has always been viewed as two independent segments, with earthquake ruptures on the northern and southern San Andreas faults deemed as mutually exclusive of one another. This implied that a single earthquake could not rupture both segments of the fault, which are separated by an aseismic section known as the creeping segment. 4 With the new methodology of UCERF3, the northern and southern San Andreas faults now have the potential to rupture together in a very large earthquake that could impact both northern and southern California simultaneously.
Figure 2: Footprint Maps of Sample Earthquake Events Comparing UCERF2 and UCERF3
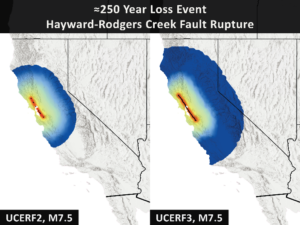
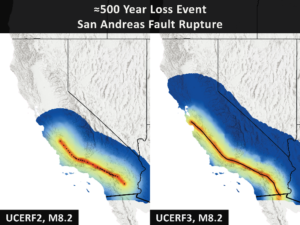
Source: CoreLogic 2016.1
What Prompted the Change?
It’s important to understand why UCERF3 has presented the possibility of multiple-segment and multiple-fault ruptures. It’s not just that the data seemed to match much better when they relaxed the fault segmentation and allowed for earthquakes to rupture multiple segments, but also that longer earthquake ruptures and larger earthquakes can in fact occur in California. This is based on lessons learned from recent earthquakes that have occurred and caused damage around the world. The fundamental lesson from these earthquakes is that faults are more interconnected at depth than previously thought in terms of their rupture and seismic potential.
This lesson was taught, very tragically, by the 2011 Thoku-oki earthquake in Japan. Prior to this event, the largest earthquake thought to be possible was a magnitude 8.2 that would rupture only the shallowest part of the megathrust fault plane off the northern coast of Hokkaido. However, the earthquake that actually occurred cascaded through six different segments of the fault plane, and this multiple-segment fault rupture resulted in an unprecedented magnitude 9.0 earthquake—the largest to ever occur in Japan. 5 Similarly, the September 2010 Darfield earthquake in the Canterbury Plains of New Zealand illustrated a rupture of multiple surface segments of the Greendale fault. 6 And the 1992 Landers earthquake in southern California exhibited an 80 km-long rupture on five separate faults within 1-5 km of each other, demonstrating that faults are much more interconnected at depth than they appear on the surface. 7 It is important that this new-found knowledge be modeled appropriately to ensure seismic hazard is fully captured.
What it Means in Terms of Insured Losses
There are three key aspects of the new hazard science that most impact earthquake risk: a general increase in the frequency of events of magnitude 5.0 to 6.5, decrease in frequency for events 6.5 to 7.5, and an increase in the frequency of large events magnitude 7.5 and greater. Earthquakes of magnitude 6.5 to 7.5 cause large losses and their relative frequency in California make these the strongest influence upon average annual loss from shaking. Earthquakes of magnitude 7.5 and greater are responsible for the largest event loss potential in the state, and increasing the frequency of these large events impacts the amount of capital needed in reserve to pay for potential losses.
The U.S. Earthquake Model from CoreLogic® is one of the first to incorporate this important new consensus-based view of earthquake hazard for California, along with new features of liquefaction, landslide, basin modeling, and both time-dependent and time-independent probabilities of occurrence. Using this new science allows for more accurately informed analysis of earthquake risk which will help the insurance industry and communities worldwide assess and prepare for potential damage from earthquakes.
Risk managers have always viewed Northern California and Southern California earthquake risk being uncorrelated because of the perceived independence of the faults in Northern and Southern California. But based on UCERF3, the new modeled view of earthquake risk in California from CoreLogic illustrates that there is a higher conditional probability of losses impacting both regions simultaneously (see Figure 3). In Figure 3, the dots along the x and y axes illustrate events which only cause losses in each region. All of the dots in between the axes generate losses in both regions. This illustrates only a few events, but is a significant number since these were previously independent.
Figure 3: Scatter Plot of Losses
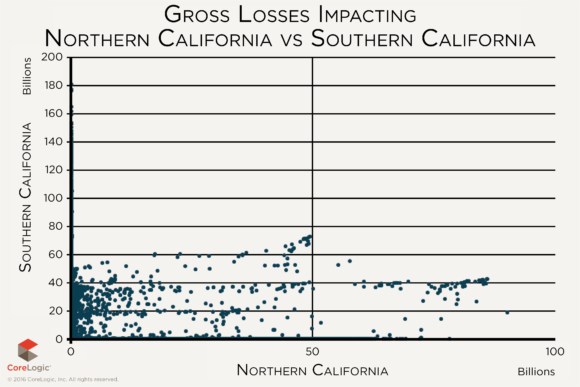
Source: CoreLogic, Inc., 2016.
The new CoreLogic model shows that there is now approximately 23 percent probability that an event causing $50B or more in insured losses in Northern California could now simultaneously cause a $30B or more loss in Southern California.
This new view of earthquake hazard from UCERF is transforming the way risk managers evaluate and manage earthquake risk with the new, increased probability that earthquakes can simultaneously cause damage across the State of California. The implications of this change span far beyond the insurance industry, however, impacting response and recovery for public safety, infrastructure, and the global supply chain. California has always been a high earthquake risk State, but this risk may have a greater impact than previously anticipated, which needs to be accordingly accommodated in preparedness planning.
Sources:
- Field, E. H., R. J. Arrowsmith, G. P. Biasi, P. Bird, T. E. Dawson, K. R. Felzer, D. D. Jackson, K. M. Johnson, T. H. Jordan, C. Madden, A. J. Michael, K. R. Milner, M. T. Page, T. Parsons, P. M. Powers, B. E. Shaw, W. R. Thatcher, R. J. Weldon II, and Y. Zeng (2014). Uniform California earthquake rupture forecast, version 3 (UCERF3)—The time‐independent model, Bulletin of the Seismological Society of America, Vol. 104, pp. 1122–1180.
- Field, E. H., G. P. Biasi, P. Bird, T. E. Dawson, K. R. Felzer, D. D. Jackson, K. M. Johnson, T. H. Jordan, C. Madden, A. J. Michael, K. R. Milner, M. T. Page, T. Parsons, P. M. Powers, B. E. Shaw, W. R. Thatcher, R. J. Weldon II, and Y. Zeng (2015). Long‐term time‐dependent probabilities for the third uniform California earthquake rupture forecast (UCERF3), Bulletin of the Seismological Society of America, Vol. 105, pp. 511–543.
- Field, E. H., T. E. Dawson, K. R. Felzer, A. D. Frankel, V. Gupta, T. H. Jordan, T. Parsons, M. D. Petersen, R. S. Stein, R. J. Weldon II, and C. J. Wills (2009). Uniform California earthquake rupture forecast, version 2 (UCERF 2), Bulletin of the Seismological Society of America, Vol. 99, pp. 2053–2107.
- http://earthquake.usgs.gov/research/parkfield/geology.php
- http://earthquake.usgs.gov/earthquakes/eqinthenews/2011/usc0001xgp/
- http://earthquake.usgs.gov/earthquakes/eqinthenews/2010/us2010atbj/
- http://earthquake.usgs.gov/earthquakes/states/events/1992_06_28.php
![]()
Was this article valuable?
Here are more articles you may enjoy.
 Florida Engineers: Winds Under 110 mph Simply Do Not Damage Concrete Tiles
  AIG’s Zaffino: Outcomes From AI Use Went From ‘Aspirational’ to ‘Beyond Expectations’
  Judge Tosses Buffalo Wild Wings Lawsuit That Has ‘No Meat on Its Bones’
  Zurich Insurance Profit Beats Estimates as CEO Eyes Beazley