
Private employers reported approximately 2.9 million nonfatal workplace injuries and illnesses in 2015, or about 48,000 fewer than in 2014, according to the U.S. Bureau of Labor Statistics.
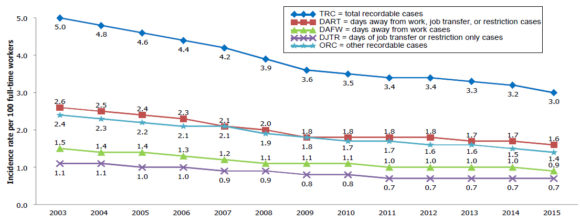
That translates into a rate of 3.0 cases per 100 equivalent full-time private industry workers.
BLS said the 2015 rate continues a pattern of annual declines that has been reported for the last 13 years except in 2012, according to its Survey of Occupational Injuries and Illnesses (SOII).
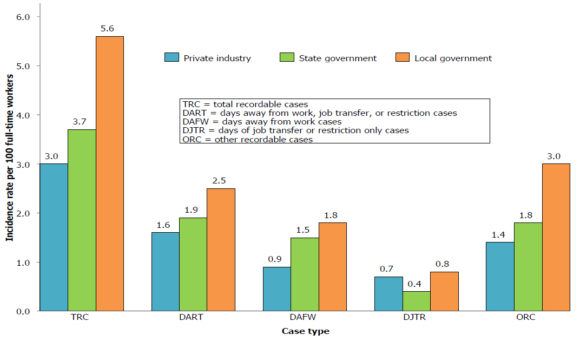
The injury and illness rate among state and local government workers o0f 5.0 cases per 100 was relatively unchanged from a year earlier but was higher than the 3.0 rate among private industry workers in 2015.
Results by Industry
Six of the 19 private industry sectors reported a decline in the rate of injuries and illnesses in 2015: mining, quarrying, and oil and gas extraction; manufacturing; transportation and warehousing; finance and insurance; health care and social assistance; and accommodation and food services.
Wholesale trade was the only sector with an increase in the rate of injuries and illnesses in 2015, rising from 2.9 cases in 2014 to 3.1 cases in 2015.
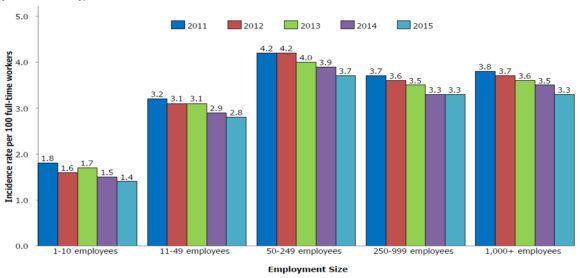
The rate of injuries and illnesses remained highest among mid-size private industry establishments (employing 50 to 249 workers) and lowest among small establishments (employing fewer than 11 workers).
Type of Case
Over half of the approximately 2.9 million private industry injury and illness cases reported in 2015 involved days away from work, job transfer, or restriction (DART). These cases occurred at a rate of 1.6 cases per 100 full-time workers. Cases not involving days away from work or days of job transfer or restriction accounted for the approximately 1.3 million remaining injury and illness cases in 2015, lowering the prior year rate by 0.1 cases to 1.4 cases per 100 full-time workers.
Injuries
Of the approximately 2.9 million nonfatal occupational injuries and illnesses reported by private industry employers in 2015, nearly 2.8 million (95.2 percent) were injuries. Among injuries, nearly 2.1 million (75.0 percent) occurred in service-providing industries, which employed 82.5 percent of the private industry workforce. The remaining nearly 0.7 million injuries (25.0 percent) occurred in goods-producing industries, which accounted for 17.5 percent of private industry employment.
Illnesses
Workplace illnesses accounted for 4.8 percent of the approximately 2.9 million injury and illness cases reported by private industry employers in 2015 and occurred at a rate of 14.6 cases per 10,000 full-time workers. Rates among the individual illness categories were relatively unchanged compared to a year earlier.
Service-providing industries accounted for 64.7 percent of private industry illness cases and had a rate of 12.0 cases per 10,000 full-time workers in 2015. Goods-producing industries accounted for 35.4 percent of all occupational illness cases in 2015, resulting in an incidence rate of 24.6 cases per 10,000 full-time workers—down from the previous year.
Public Sector
An estimated 752,600 injury and illness cases were reported in 2015 among the approximately 18.4 million state and local government workers—for example, elementary and secondary schools, hospitals, and police or fire protection—resulting in a rate of 5.1 cases per 100 full-time workers. That rate was nearly the same as last year (5.0 cases) and higher than the rate among private industry workers (3.0 cases) in 2015. Approximately 4 in 5 injuries and illnesses reported in the public sector occurred among local government workers in 2015, resulting in an injury and illness rate of 5.6 cases per 100 full-time workers—higher than the 3.7 cases per 100 full-time workers in state government. The incident rate of injuries and illnesses among state government workers declined significantly from 2014 (4.1 cases), while the rate among local government workers was statistically unchanged from a year earlier.
State Estimates
The report contains data from private industry and public sector for 41 states, 3 U.S. territories and the District of Columbia for 2015. Below is an updated map showing only private industry case rates by state. BLS said the online map of states on the its website will have the updated state estimates on Nov. 10.
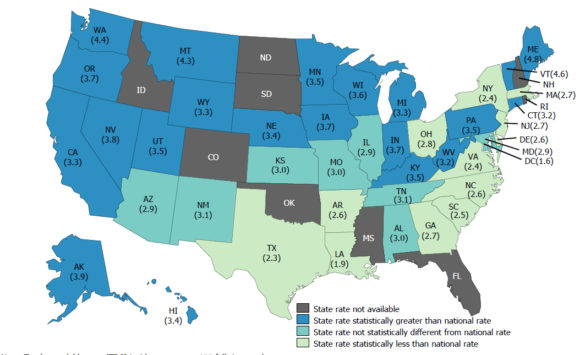
Among individual states for which estimates are available for 2015, the private industry total recordable cases (TRC) rate declined in 9 states and was relatively unchanged in 32 states and in the District of Columbia, compared to a year earlier. The private industry TRC injury and illness incidence rate was higher in 21 states than the national rate of 3.0 cases per 100 full-time workers, lower than the national rate in 12 states and in the District of Columbia, and about the same as the national rate in 8 states. BLS said that factors such as differences in the composition of industry employment may influence state incidence rates and should be considered whenever comparing rates among different states.
Key tables from Bureau of of Labor statistics on workplace injuries and illnesses for 2015:
- Table 1. Incidence rates of nonfatal occupational injuries and illnesses by case type and ownership, selected industries, 2015
- Table 2. Numbers of nonfatal occupational injuries and illnesses by case type and ownership, selected industries, 2015
- Table 3. Incidence rates of nonfatal occupational injuries and illnesses by major industry sector, employment size, and ownership, 2015
- Table 4. Number of cases and incidence rate of nonfatal occupational injuries and illnesses for industries with 100,000 or more cases, 2015
- Table 5. Incidence rate and number of nonfatal occupational injuries by selected industries and ownership, 2015
- Table 6a. Incidence rates of nonfatal occupational illnesses by major industry sector, category of illness, and ownership, 2015
- Table 6b. Number of nonfatal occupational illnesses by major industry sector, category of illness, and ownership, 2015
- Table 7. Incidence rates of nonfatal occupational injuries and illnesses by major private industry sector and selected case types, 2013-2015
Was this article valuable?
Here are more articles you may enjoy.
 Former Broker, Co-Defendant Sentenced to 20 Years in Fraudulent ACA Sign-Ups
  Zurich Insurance Profit Beats Estimates as CEO Eyes Beazley
  AI Claim Assistant Now Taking Auto Damage Claims Calls at Travelers
  Palantir Decamps to Miami Co-Working Space in Surprise Move