
Grades assigned to the insurance regulatory systems in the Midwest states of Illinois, Indiana, Iowa, Kansas, Michigan, Minnesota, Missouri, Nebraska, North Dakota, Ohio, South Dakota and Wisconsin range from A to D in a report recently released by a conservative-leaning research organization that annually assesses the effectiveness of states’ insurance regulatory systems.
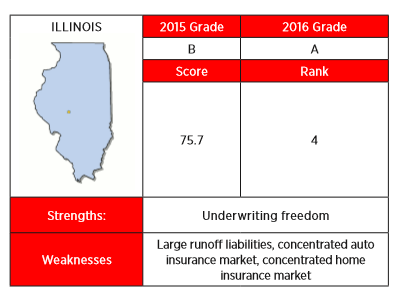
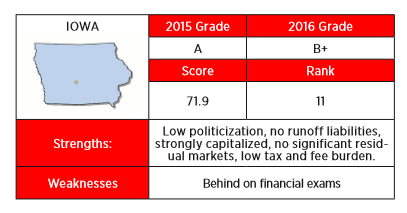
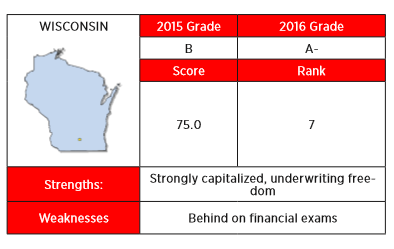
Illinois (A), Iowa (B+) and Wisconsin (A-) had the highest overall grades of the Midwest states, with a ranking of four, 11, and seven, respectively.
The R Street Institute’s 2016 Insurance Regulation Report Card scores state insurance regulatory environments in seven different categories: politicization; fiscal efficiency; solvency regulation; auto insurance market, homeowners insurance market, residual markets and underwriting freedom.
Overall, Vermont received the highest grade of all states with an A+ and North Carolina came in last with a grade of F.
R Street bills itself as a think tank dedicated to free markets and acknowledges that it believes that “an open and free insurance market maximizes the effectiveness of competition and best serves consumers.” It grades states’ regulatory systems against principles of “limited, effective and efficient” government.
The report focuses on personal lines. Author R.J. Lehmann writes that R Street believes “states have done an effective job of encouraging competition and, at least since the broad adoption of risk-based capital requirements, of ensuring solvency. As a whole and in most individual states, U.S. personal lines markets are not overly concentrated. Insolvencies are relatively rare and, through the runoff process and guaranty fund protections enacted in nearly every state, generally quite manageable.”
R Street does believe there’s a role for insurance regulation, particularly in the area of insurer solvency, Lehmann told Insurance Journal. “We’re not going to say it’s not ideological, but it’s not anti-government,” he said.
“We are free market advocates. That is not something we would hide,” Lehmann added.
Politicization
The less politics are involved in the state insurance regulatory system the better, according to R Street.
Therefore, the 11 states in which the insurance commissioner is elected — California, Delaware, Georgia, Kansas, Louisiana, Mississippi, Montana, North Carolina, North Dakota, Oklahoma and Washington — automatically had five points knocked off their scores.
The report uses as a baseline those states in which the commissioner is appointed and serves at the pleasure of the governor. This means that no points were added or subtracted for the 19 states that have such a structure.
One point was added to the scores of the five states — Alaska, Hawaii, Nevada, Oregon and South Dakota — in which the commissioner is appointed by an executive officer of the state other than the governor.
In three states — Florida, New Mexico and Virginia — the commissioner is appointed by a public board. Viewing such a system as advantageous from a political independence perspective, R Street adds three points to the scores for those states.
Insurance commissioners in 12 states — Arizona, Idaho, Iowa, Kentucky, Maine, Maryland, Michigan, New Hampshire, Pennsylvania, Texas, Vermont and West Virginia — are appointed for a set term and cannot be removed without a good reason. To R Street, this type of structure offers regulators the most political independence so five points are added to the politicization scores in those states.
Fiscal Efficiency
State insurance departments collect a lot of money from the entities involved in the business of insurance in their jurisdiction. R Street’s analysis judges states on how well they manage and use the vast amounts of capital raised through regulatory fees, assessments, premium taxes, penalties and other revenue sources.
Citing National Association of Insurance Commissioner (NAIC) data, R Street said the 50 states, Puerto Rico and the District of Columbia collected around $2.92 billion in insurance industry regulatory fees and assessments in 2015. However, all of the jurisdictions together spent less than half that amount — $1.41 billion on insurance regulation last year.
Points were removed from a state’s score if it collects more money from the insurance industry in fees and assessments than it spends on regulatory activities. In other words, states that had a “regulatory surplus” lost points in the fiscal efficiency category. The report also looked at what it deemed a state’s “tax and fee burden” and judged states on the overall “fiscal burden” they place on insurance products.
R Street’s ratings for fiscal efficiency range from a high of 15.0 points (Michigan) to a low of 3.1 points (Massachusetts).
Solvency Regulation
In R Street’s view, the most important job for a state insurance department is monitoring the solvency of the companies it regulates.
In assessing states’ solvency regulation R Street looked at how often insurance departments examine the financial strength of companies they regulate, and how well it does in catching the problems that lead to insurance carrier insolvencies. Included in the assessment was study of the “in-progress claims liability of insurers placed in runoff, supervision, conservation, receivership and liquidation” in each state.
In its analysis, R Street also found Arizona, New Mexico and Texas to have “somewhat thinly capitalized markets,” while some of the most strongly capitalized markets were found in Wisconsin, South Dakota, New Jersey and Hawaii.
Solvency regulation category scores range from a high of 17.0 points for Nevada to a low of 7.1 points for Texas.
Auto and Homeowners Insurance Markets
With regard to auto and home insurance markets, R Street focused “on the concentration and market share of insurance groups within each market; and the long-term loss ratios reported by companies operating in those markets.”
Loss ratios are examined over a period of five years. Points were taken off for both very high loss ratios and very low loss ratios. Lehmann explained that if loss ratios are too high insurers are not charging enough, and if loss ratios are too low they are charging too much.
“Either is a bad sign,” he said.
For instance, states with high loss ratios have a difficult time attracting insurers. Lehman pointed out that in Michigan, which has extremely high loss ratios, companies are required to provide unlimited lifetime medical benefits. “That is a serious problem for any company trying to do business there,” he said.
On the other hand, low loss ratios are an indication of a non-competitive market, with companies not lowering premiums even though they are profitable.
“We consider that a sign that the market is not very competitive,” Lehmann said.
Auto insurance scores ranged from the least competitive, 0.0 points (Michigan), to the most competitive, 10.0 points (California and Maine). In the homeowners market, scores ranged from 0.0 (Hawaii) to 10.0 points (New Jersey).
In the Midwest, the respective scores for auto and homeowners insurance regulation are: Illinois, 6.3 and 4.6; Indiana, 8.7 and 7.1; Iowa, 8.3 and 6.6; Kansas, 8.9 and 7.3; Michigan, 0.0 and 7.5; Minnesota, 7.7 and 6.8; Missouri, 8.1 and 6.3; Nebraska, 8.2 and 3.1; North Dakota, 8.2 and 6.1; Ohio, 9.3 and 8.2; South Dakota, 8.0 and 4.0; and Wisconsin, 8.7 and 8.0.
Residual Markets and Underwriting Freedom
R Street examined state residual markets for auto and homeowners insurance, as well as specialty funds such as California’s earthquake insurance pool, Florida’s catastrophe fund, Michigan’s catastrophe fund for auto insurance claims and various workers’ compensation funds.
The report recognizes that “no state has ever allowed its residual market to fail, there typically is an implicit assumption that states will stand behind a residual market pool or chartered entity if it encounters catastrophic losses.”
Midwest States at a Glance
| State | 2015 | 2016 | 2016 Rank | Strengths | Weaknesses |
| Illinois | B | A | 4 | Underwriting freedom | Large runoff liabilities, concentrated auto insurance market, concentrated home insurance market |
| Indiana | C+ | B | 15 (tie) | No significant residual markets | Large runoff liabilities |
| Iowa | A | B+ | 11 | Low politicization, no runoff liabilities, strongly capitalized, no significant residual markets, low tax and fee burden | Behind on financial exams |
| Kansas | C+ | C | 33 (tie) | No special strengths | Highly politicized |
| Michigan | C | C+ | 30 | Low politicization, no regulatory surplus, ahead on financial exams, low tax and fee burden | Very high auto loss ratio |
| Minnesota | C+ | B | 14 | No special strengths | Behind on financial exams |
| Missouri | B | B | 17 (tie) | No special strengths | Large runoff liabilities |
| Nebraska | A- | B | 20 | No special strengths | Very high homeowners loss ratio |
| North Dakota | C | D+ | 41 | No runoff liabilities, competitive auto insurance market | Highly politicized, very low auto loss ratio, very low homeowners loss ratio, monopoly workers comp system, little underwriting freedom |
| Ohio | B | B | 17 (tie) | Underwriting freedom | Large runoff liabilities; monopoly workers’ comp system |
| South Dakota | B+ | B | 26 | No runoff liabilities; strongly capitalized, no significant residual markets | Large regulatory surplus, behind on financial exams, very high auto loss ratio, very high homeowners loss ratio |
| Wisconsin | B | A- | 7 | Strongly capitalized, underwriting freedom | Behind on financial exams |
Residual market scores ranged from 0.0 points (North Carolina) to 15.0 points, for 13 states with no significant residual markets.
As to underwriting freedom, the report subtracted points for states regulatory practices that include “desk drawer” rules, which Lehmann described as rules that regulators apply that are not on the books.
Regulators tend to apply such rules without providing the opportunity to comment on them, he said. “If you know that there’s a certain kind of requirement that would always be denied, even if there’s no rule that it should be denied, we consider that a desk drawer rule. If you try to obey the law as written, you still could be denied any number of business requests.”
Illinois was found to have the most liberal rate regulation policies, followed by Wyoming and Oklahoma. California was deemed to have the strictest underwriting rules of all states.
The insurance departments in Illinois, which was upgraded this year, and North Dakota, which received the lowest grade of the Midwest states, did not respond to requests for comment about R Street’s 2016 Insurance Regulation Report Card.
Lehmann and other fellows at R Street Institute are authors of the Right Street blog on Insurance Journal.com.
IJ West Editor Don Jergler contributed to this report.
Related:
- West Regulation Report Card: California Most Politicized State
- Southeast Regulation Report Card: North Carolina Flunks; Florida, South Carolina Dispute Grades
- East Regulation Report Card: Vermont Ranks Best for 3rd Straight Year
- South Central Regulation Report Card: Texas’ Grade Rises, Arkansas’ Drops
- State Regulation Report Card: R Street Grades Them All from Best to Worst
Topics California Texas Auto Legislation Profit Loss Workers' Compensation Underwriting Michigan North Carolina Homeowners Ohio Illinois Market Missouri Kansas
Was this article valuable?
Here are more articles you may enjoy.
 US Offers $20 Billion Reinsurance Plan to Spur Gulf Oil Flow
  Greek Oil Tanker Exits Hormuz Shipping Strait With Signal Off
  After Florida Charged People With Selling Insurance Licenses, 12 More Arrested
  Marine Insurers Cancel War Risk Cover as Iran Conflict Escalates