
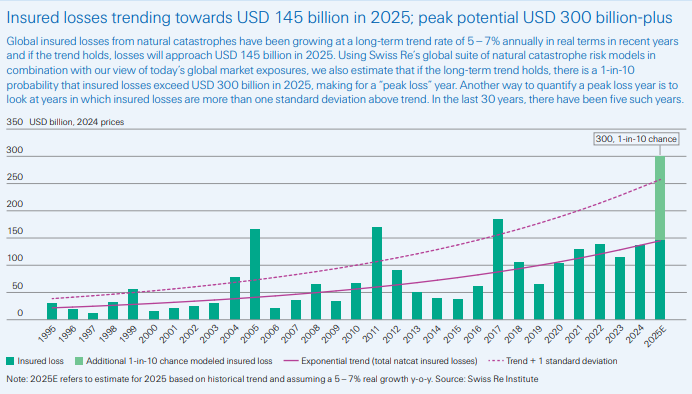
Global insured losses from natural catastrophes hit US$137 billion in 2024, following the 5%-7% annual growth rate that has been the norm in recent years, according to Swiss Re analysis.
If this trend continues, global insured losses will approach US$145 billion in 2025, mainly driven by secondary perils such as severe convective storms (SCS), floods and wildfires, said the Swiss Re sigma report titled “Natural catastrophes: insured losses on trend to USD 145 billion in 2025.”
While loss severity for nat cats is rising globally, North America accounted for almost 80% of global insured losses in 2024, due to the region’s exposure to severe thunderstorms, hurricanes, floods, wildfires, and earthquakes, the report said. (Editor’s note: the 80% figure can be found on page 29 of the main report, table 3).
“As has been the case in recent years, in 2024 most of the global insured losses were driven by secondary perils, in particular severe convective storms in the US,” Swiss Re said, noting, that the deadly fires in Los Angeles in January this year point to another year of high losses from secondary perils.
Global economic losses from catastrophes were US$318 billion, the highest since 2017 (US$448 billion in 2024 prices). “Around 43% were covered by insurance, highlighting the continued existence of large protection gaps in many parts of the world, including in advanced economies,” the report said. The 2024 insurance protection gap of $181 billion — up from $177 billion in 2023 — is the difference between overall economic losses and the amount covered by insurers.
Peak-Loss Years
Despite the high price tag from secondary perils, Swiss Re warned, it is primary perils (tropical cyclones and earthquakes) that remain the biggest contributor to insured losses overall. Swiss Re pointed to the five so-called “peak loss” years that have occurred in the last 30 years (1999, 2004, 2005, 2011 and 2017), when annual losses were way above trend.
In 2017 – the last peak-loss year – Hurricanes Harvey, Irma and Maria drove global insurance losses to 111% above trend. Swiss Re cautioned that the subsequent period of quiet since then did not slow the underlying growth of risk.
Swiss Re’s natural catastrophe models point to a 1-in-10 probability that global insured losses could reach as high as US$300 billion in 2025, creating next peak-loss year. (See above graphic).
Peak loss years, “due to either the accumulation of many loss events or those from a few individual large events, should not be considered a freak occurrence,” Swiss Re said. “History repeats, and it’s not a question of if, but when the insurance industry will face the next peak loss year.”
Los Angeles Wildfires
Although 2025 began with record insured wildfire losses of approximately $40 billion in Los Angeles, Swiss Re explained that the fires on their own will not cause a notable deviation from the annual loss growth trend for natural catastrophes (of 5%-7%).
“Of the total losses, insurance claims for residential property were at least US$30 billion,” said Swiss Re, estimating this will likely generate a loss ratio of around 200% for homeowners’ insurers in California.
“Assuming an around 50% base load, the loss ratio is heading towards 250%. The last time the loss ratio was of similar magnitude was in 2017 (201%) and 2018 (176%), when wildfires in California triggered record losses for that time,” the report added.
“We estimate that two-thirds of payouts to cover the fire losses will come from primary insurers, one-third to be paid by reinsurers. The scale of losses was so large that many excess-of-loss reinsurance covers were triggered. The reinsurance share of loss would have increased further with an even bigger loss.”
In years when losses are close to trend, Swiss Re said, primary insurers cover the majority of property claims, but when major disasters strike and losses rise well above trend, “reinsurers step in to cover more than half of the losses in excess of trend.”
Homeowners Insurance
Homeowners in catastrophe-prone states are feeling the pain of rising premiums, as their insurers seek to return to underwriting profitability.
In the US, homeowners’ insurers have seen their net incurred losses increase by 8% annually since 2018 – a trend driven by a post-COVID surge in construction and claims costs. “The consequence of the latter is that homeowner insurers have seen several years of underwriting losses,” Swiss Re said.
“After several years of underwriting losses, homeowners’ premiums only recently caught up with housing replacement costs. However, ongoing underwriting losses suggest that premiums are still not commensurate with the risk, and that further alignment is necessary to sustain insurance business.”
The states with highest exposures to natural catastrophes are also those where, in general, homeowner premiums are highest, the report said, pointing to five states – Florida, Texas, California, Louisiana and Colorado – which account for around 50% of all natural catastrophe losses in the U.S.
“Historically, Louisiana has suffered the highest natural catastrophe losses per policy, followed by Florida. These have mostly been on account of losses emanating from hurricane events,” the report confirmed.
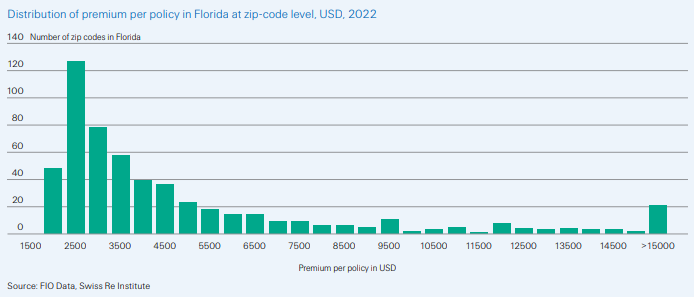
“Homeowner premiums per household in the state of Florida are twice the national average,” the report said, noting that in states with higher average premiums (such as Florida), extremely high premium levels are localized.
For example, in 11% of the Florida’s zip codes, premiums per policy were above US$10,000, the report said. “These are typically coastal zip codes with highest risk of storm surge and/or wind damage.” (See above graphic).
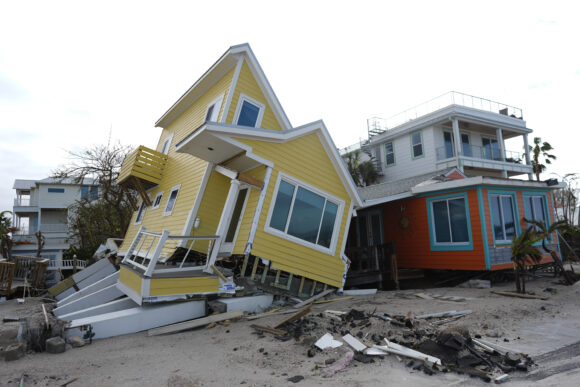
Photograph: A house lies toppled off its stilts after the passage of Hurricane Milton, in Bradenton Beach on Anna Maria Island, Fla., Oct. 10, 2024. (AP Photo/Rebecca Blackwell, File)
Related:
Topics Trends Claims Profit Loss
Was this article valuable?
Here are more articles you may enjoy.
 Florida’s Share of Claims Lawsuits Now About Half of 2020 Numbers, Data Show
  Two Years in, Ortiz Steps Down as CEO of Florida Re
  Mapfre to Acquire Safety Insurance for $1.54 Billion in Cash Deal