

Insured building values in the U.S. now exceed $40 trillion — including residential, commercial and industrial structures, according to a new report from catastrophe modeling firm Karen Clark & Co.
When contents and time element exposures are added in, the insured property values swell to over $80 trillion, the report found. Along with increasing values, there are more concentrated pockets of exposure, particularly in areas vulnerable to natural catastrophes.
Karen Clark & Co. said the state with the most property value is California — followed by New York and Texas. The top 10 states account for over 50 percent of the U.S. total.
Vulnerability to Storms, Other Coastal Hazards Continues to Rise
The report also showed that the U.S. vulnerability to hurricanes and other coastal hazards continues to rise due primarily to increasing concentrations of property values along the coast. Of the $80 trillion in total U.S. property exposure, nearly $15 trillion is in the first tier of Gulf and Atlantic coastal counties.
The top five counties — Los Angeles, Calif., New York, N.Y., Cook, Ill., Harris, Texas, and Orange, Calif. — each have over $1 trillion of exposure and, on a combined basis, account for more than 10 percent of total U.S. property value. One county – Los Angeles – accounts for over three percent of total insured value. There are nearly 2,000 individual five-digit ZIP codes with over $10 billion of exposure and 26 with $50 billion or more, the report said.
The report noted that despite the economic downturn, the cost to replace residential and commercial properties destroyed by natural disasters has continued to rise.
According to the Craftsman National Building Cost data, the average square foot costs for single family homes rose slightly over the past two years. There are wide disparities across the U.S. with average square foot costs — ranging from a low of $60 per square foot in some areas of the country to a high of over $200 per square foot in cities such as New York and San Francisco.
The maps below show the distributions of property values by state and county. (The top 10 states account for over 50 percent of the U.S. total, and the top 10 counties account for 15 percent.)
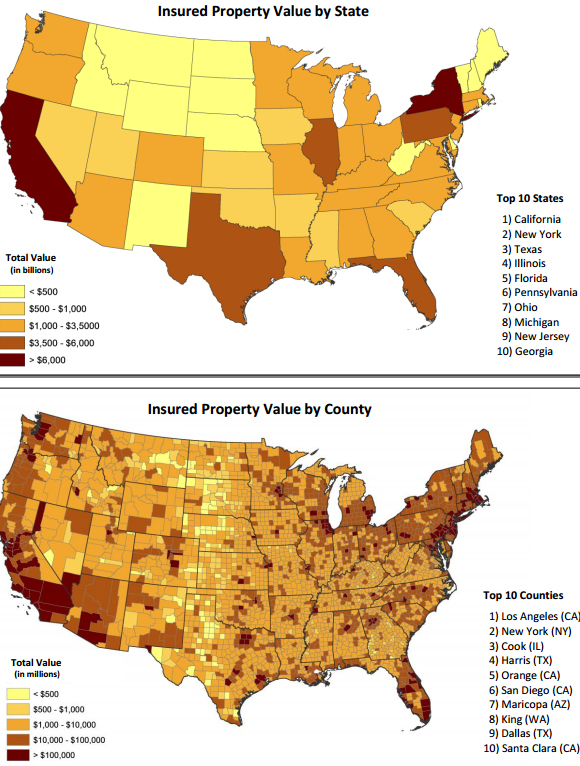
Source: Karen Clark & Co.
Was this article valuable?
Here are more articles you may enjoy.
 Hellman & Friedman’s Hub International Seeks $3 Billion in IPO
  Robotaxi Riders Are Falling Asleep, Sparking Frantic 911 Calls
  El Niño Likely Strongest in 75 Years, US Forecasters Say
  20 Years After Hurricane Katrina: Are Insurers Ready for a Different $100B Disaster?