

Overall, just 26 percent ($54 billion) of overall economic losses caused by natural disasters worldwide during 2016 were covered by insurance as a higher percentage of damage occurred in areas with a lower insurance penetration. However, the public and private insurance industry losses were seven percent above the 16-year average and the highest insured loss total since 2012. The 2016 experience marked the end of a four-year downward trend since the record year in 2011.
That’s according to Impact Forecasting, Aon Benfield’s catastrophe model development team, reporting in its 2016 Annual Global Climate and Catastrophe Report.
The report reveals that there were 315 natural catastrophe events in 2016 that generated economic losses of $210 billion. For historical context, 2016 was the seventh highest year on record with the combined economic loss exceeding the $200 billion threshold for the first time since 2013.
The top three perils—flooding, earthquake and severe weather—combined for 70 percent of all economic losses in 2016. While at least 72 percent of catastrophe losses occurred outside of the United States, it still accounted for 56 percent of global insured losses.
There were at least 34 natural disasters that caused more than $1.0 billion in economic damage around the globe, though just 11 events had insurable losses reach the same threshold. The vast majority of the billion-dollar events (30) were weather-related, and only nine had insured losses at or above $1.0 billion.
Steve Bowen, Impact Forecasting director and meteorologist, said that after a decline in catastrophe losses during the previous four years, 2016 marked a “bit of an uptick” in natural peril costs to the global economy.
“When recognizing that we have seen a nominal increase in both annual and individual weather disaster costs in recent decades, we recognize that factors such as climate change, more intense weather events, greater coastal exposures and population migration shifts are all contributors to the growing trend,” Bowen said. “With these parameters in place, and forecasts continuing to signal greater risk and vulnerability, it is anticipated that weather-related catastrophe losses will further increase in the coming years.”
Notable events driving economic and insured losses in 2016 included:
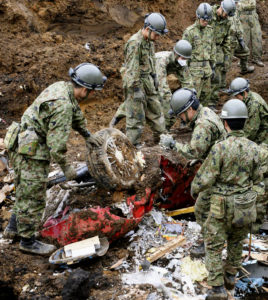
- A series of April earthquakes in Japan was the costliest event both economically ($38 billion in losses) and for the insurance industry ($5.5 billion)
- Six of the top 10 costliest insured loss events occurred in the United States, including Hurricane Matthew and multiple severe weather outbreaks
- For the fourth consecutive year, flooding was costliest overall peril at $62 billion (30% of the total). The most significant flood events were along the Yangtze River basin in China ($28 billion in damage) and in the US state of Louisiana($10-15 billion in losses).
- A notable entry into the top five insured losses was for a ‘secondary’ peril – wildfire – in Fort McMurray, Canada that cost the industry nearly $3.0 billion.
- The United States experienced 14 individual billion-dollar economic loss events and Asia-Pacific experienced 13 such events – compared to four in EMEA and three in the Americas.
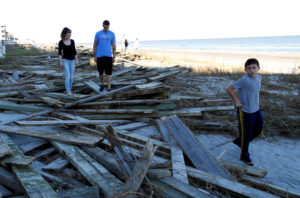
People look around the debris of the pier damaged by Hurricane Matthew in Surfside Beach, South Carolina, U.S. October 9, 2016. REUTERS/Randall Hill
In its 2015 annual report on catastrophes, Aon Benefield reported that global natural disasters in 2015 caused a combined total insured loss of $35 billion – 31 percent below the 15-year average of $51 billion and the lowest annual insured loss total since 2009. Total economic losses from natural catastrophes in 2015 came in at $123 billion – 30 percent below the 15-year average of $175 billion. Insurance covered just 28 percent of economic losses.
| Top 10 Global Economic Loss Events | ||||||
| Date(s) | Event | Location | Deaths | Economic Loss (USD) | Insured Loss (USD) | |
| April 14 & 16 | Earthquake | Japan | 154 | 38 billion | 5.5 billion | |
| Summer | Flooding | China | 475 | 28 billion | 750 million | |
| Sept. 28 – Oct. 10 | HU Matthew | US, Caribbean | 605 | 15 billion | 5.0 billion | |
| August | Flooding | United States | 13 | 10 to 15 billion | 3.0 billion | |
| Yearlong | Drought | China | 0 | 6.0 billion | 200 million | |
| May / June | Flooding & SCS | Western/Central Europe | 20 | 5.5 billion | 3.4 billion | |
| Yearlong | Drought | India | 0 | 5.0 billion | 750 million | |
| August 24 | Earthquake | Italy | 299 | 5.0 billion | 100 million | |
| July | Flooding | China | 289 | 4.7 billion | 200 million | |
| May | Wildfire | Canada | 0 | 4.5 billion | 2.8 billion | |
| ALL OTHER EVENTS | 83 billion | 33 billion | ||||
| TOTALS | 210 billion1 | 54 billion1,2 | ||||
| 1 Subject to change as loss estimates are further developed | ||||||
| 2 Includes losses sustained by private insurers and government-sponsored programs | ||||||
Source: 2016 Annual Global Climate and Catastrophe Report
Aon and Steve Bowen produced a short film on the key findings of the report, shot in St. Augustine, Florida, which was impacted by Hurricane Matthew.
Related:
Topics USA Trends Catastrophe Natural Disasters Profit Loss Flood China Aon
Was this article valuable?
Here are more articles you may enjoy.
 Florida Property Tax Cut Plan Relies on Population Boom That Has Slowed Dramatically
  Robotaxi Riders Are Falling Asleep, Sparking Frantic 911 Calls
  Hellman & Friedman’s Hub International Seeks $3 Billion in IPO
  Ryanair Passenger Partly Sucked From Jet After Window Breaks