
Seven states, including five in the Great Plains, saw their median age decline between 2012 and 2013, according to U.S. Census Bureau estimates. At the same time, the median age for the U.S. as a whole ticked up from 37.5 years to 37.6 years.
These latest census reports examine population changes among groups by age, sex, race and Hispanic origin nationally, as well as all states and counties, between April 1, 2010, and July 1, 2013.
“We’re seeing the demographic impact of two booms,” Census Bureau Director John Thompson said. “The population in the Great Plains energy boom states is becoming younger and more male as workers move in seeking employment in the oil and gas industry, while the U.S. as a whole continues to age as the youngest of the baby boom generation enters their 50s.”
The largest decline in the nation was in North Dakota, with a decline of 0.6 years between 2012 and 2013. The median age in four other Great Plains states — Montana, Wyoming, South Dakota and Oklahoma — also dropped. Alaska and Hawaii also saw a decline in median age.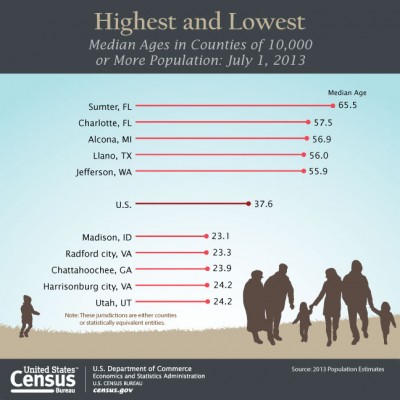
In addition, the median age fell in 403 of the nation’s 3,143 counties, many of which were in the Great Plains. Williams, N.D., the center of the Bakken shale energy boom, led the nation with a decline of 1.6 years. Next to Alaska, North Dakota had a heavier concentration of males (51.1 percent of the total population) than any other state.
The nation as a whole grew older as the oldest baby boomers became seniors. The nation’s 65-and-older population surged to 44.7 million in 2013, up 3.6 percent from 2012. By comparison, the population younger than 65 grew by only 0.3 percent.
These statistics also include population estimates for Puerto Rico by age and sex.
The nation is a study in contrasts when it comes to local age structure. There was a more than 42-year difference in the median ages of the county with the highest median age — Sumter, Fla., at 65.5 — and the county with the youngest median age — Madison, Idaho, at 23.1.
More Diverse
Non-Hispanic, single-race whites remained the nation’s largest group with a population of 197.8 million. The total of all other groups was 118.3 million, or 37.4 percent of the population. Non-Hispanic single-race whites made up 52.4 percent of the population under 18.
Asians were the fastest-growing group from 2012 to 2013, though that distinction has alternated between Asians and Hispanics over the years. The Asian population increased by almost 2.9 percent to 19.4 million, an increase of about 554,000 people. Hispanics remained the second largest group overall, growing by 2.1 percent (or more than 1.1 million) to slightly more than 54 million. Hispanics were 17.1 percent of the total population in 2013, up about 0.2 percentage points from 2012. The primary driver of Asian population growth in 2013 was international migration, accounting for 61 percent of the total Asian population change in the last year. Hispanic population growth, on the other hand, was fueled primarily by natural increase (births minus deaths), which accounted for about 78 percent of the total Hispanic population change.
Following Asians in rate of growth were Native Hawaiians and Other Pacific Islanders (increasing 2.3 percent to just over 1.4 million), American Indians and Alaska Natives (increasing 1.5 percent to slightly more than 6.4 million) and blacks or African-Americans (increasing 1.2 percent to 45 million).
The non-Hispanic white alone population was the only group to have natural decrease (more deaths than births) from 2012 to 2013. However, due to migration, its population rose 0.1 percent from 2012 to 2013, reaching 197.8 million. Because of its slow rate of growth relative to other groups, its share of the total population declined from 63.0 percent to 62.6 percent over the period.
Highlights for each race group and Hispanics, age groups and both sexes at the national, state and county levels follow. For Hispanics and each of the race groups listed below (except for American Indians and Alaska Natives), their populations rose at a faster rate from 2012 to 2013 in North Dakota than in any other state.
Hispanics
- California had the largest Hispanic population of any state on July 1, 2013 (14.7 million). However, Texas had the largest numeric increase within the Hispanic population since July 1, 2012 (213,000). New Mexico had the highest percentage of Hispanics at 47.3 percent.
- Los Angeles County had the largest Hispanic population of any county (4.8 million) in 2013 while Miami-Dade, Fla., had the largest numeric increase since 2012 (50,000). Starr County — on the Mexican border in Texas — had the highest share of Hispanics (95.7 percent).
Blacks
- New York had the largest black or African-American population of any state or equivalent as of July 1, 2013 (3.7 million); Texas had the largest numeric increase since 2012 (78,000). The District of Columbia had the highest percentage of blacks
(51.0 percent), followed by Mississippi (38.1 percent). - Cook County, Ill. (Chicago) had the largest black or African-American population of any county in 2013 (1.3 million), and Harris, Texas (Houston) had the largest numeric increase since 2012 (18,000). Holmes, Miss., was the county with the highest percentage of blacks or African-Americans in the nation (83.2 percent).
Asians
- California had both the largest Asian population of any state (6.1 million) in July 2013 and the largest numeric increase of Asians since July 1, 2012 (142,000). Hawaii was the nation’s only majority-Asian state, with people of this group comprising 56.3 percent of the total population.
- Los Angeles had the largest Asian population of any county (1.6 million) in 2013 and the largest numeric increase (26,000) since 2012. At 60.4 percent, Honolulu County had the highest percentage of Asians in the nation.
American Indians and Alaska Natives
- California had the largest American Indian and Alaska Native population of any state in 2013 (1.1 million) and the largest numeric increase since 2012 (13,000). Alaska had the highest percentage (19.4 percent).
- Los Angeles had the largest American Indian and Alaska Native population of any county in 2013 (233,000), and Maricopa, Ariz., the largest numeric increase (4,600) since 2012. Shannon County, S.D. — on the Nebraska border and located entirely within the Pine Ridge Indian Reservation — had the highest percentage (94.1 percent).
Native Hawaiians and Other Pacific Islanders
- Hawaii had the largest population of Native Hawaiians and Other Pacific Islanders of any state (366,000) in 2013 and the highest percentage (26.1 percent). California had the largest numeric increase since 2012 (7,000).
- Honolulu had the largest population of Native Hawaiians and Other Pacific Islanders of any county (239,000) in 2013, and Hawaii County had the highest percentage (34.4 percent). Clark, Nev., had the largest numeric increase since 2012 (1,100).
Non-Hispanic White Alone
- California had the largest non-Hispanic white alone population of any state in 2013 (15.0 million). Texas had the largest numeric increase in this population group since 2012 (51,000). Maine had the highest percentage of the non-Hispanic white alone population (94.0 percent).
- Los Angeles had the largest non-Hispanic white alone population of any county (2.7 million) in 2013. Maricopa, Ariz., had the largest numeric increase in this population since 2012 (23,000). Lincoln County, W.Va., comprised the highest percentage (98.2 percent) of single-race non-Hispanic whites.
Age Groups: Nation
- The 85-and-older population grew by about 3 percent between 2012 and 2013 to 6 million. The number of people age 100 and over reached 67,000 in 2013.
- The total number of children under age 5 was just under 20 million in 2013 or 6.3 percent of the population. The number of children age 5 to 13 was just over 37 million in 2013 (11.7 percent of the population).
- The number of high school-age children (age 14 to 17) was 16.6 million or 5.3 percent of the population in 2013.
- In 2013, there were about 198 million working-age adults (age 18 to 64), representing 62.6 percent of the total population.
- In 2013, the median age of the minority population — i.e., all people who were not in the non-Hispanic single-race white group — was 30.5 years. The non-Hispanic white alone population was older, with a median age of 42.9 years in 2013.
Age Groups: States
- Florida had the highest percentage of its total population age 65 and older (18.7 percent), followed by Maine (17.7 percent). Alaska had the lowest percentage of its population 65 and older (9.0 percent), followed by Utah (9.8 percent).
- Utah had the highest percentage of its total population under age 5 at 8.8 percent, followed by Alaska (7.5 percent). The two states with the lowest percentage of their total population under age 5 were Vermont (4.9 percent)and Maine (4.9 percent).
- here was a greater than 13-year difference in the median ages of the state with the highest median age — Maine at 43.9 — and the state with the lowest median age — Utah at 30.2.
- New Hampshire experienced the largest increase in median age, from 42.0 to 42.3.
Age Groups: Counties
- There were 60 counties where the median age was greater than 50, and 61 counties where the median age was less than 30.
- Las Animas, Colo., experienced the largest increase in median age, 1.2 years, from 44.5 to 45.7.
- Sumter, Fla., had the highest proportion of its population age 65 and older (51.6 percent), and also had the lowest proportion of its population under age 5 (2.1 percent) on July 1, 2013.
- Chattahoochee., Ga., had the lowest proportion of its population age 65 and older (3.8 percent).
- Shannon, S.D., had the highest proportion of its population under age 5 (11.6 percent).
Sex
- There were only 10 states where males made up the majority of the population on July 1, 2013. Alaska had the highest percentage of men at 52.4 percent, followed by North Dakota (51.1 percent), Wyoming (51.0 percent), Hawaii (50.5 percent), Nevada (50.4 percent), Utah (50.3 percent), Colorado (50.2 percent), South Dakota (50.2 percent), Montana (50.2 percent), and Idaho (50.1 percent).
- The District of Columbia had a higher percentage of females than any state at 52.6 percent, followed by Delaware (51.6 percent), Rhode Island (51.6 percent), Massachusetts (51.5 percent) and Maryland (51.5 percent).
Source: U.S. Census Bureau
Topics USA California Texas Maine
Was this article valuable?
Here are more articles you may enjoy.
 Developer Downplays Structural Concerns at ‘Unstable’ Midtown Manhattan Tower
  NYC to Publicly Identify Buildings Testing Positive for Legionnaires’ Bacteria
  Premiums Will Skyrocket by 2035; Discounts Not Enough for Wind Mit, Studies Say
  Merger Suits Stall Under DOJ Boss Who Opposes Blocking Deals