
Florida, Rhode Island, Louisiana, California and Massachusetts are the top 5 states for exposure to multiple natural hazards, according to an analysis by CoreLogic, a property data and analytics firm.
Michigan, West Virginia, New York, North Dakota and Vermont have the lowest score for exposure to multiple hazards, the report said.
The analysis was derived from the CoreLogic Hazard Risk Score (HRS), a new tool that gathers data on multiple natural hazard risks and combines them into a single score ranging from 0 to 100. The overall score indicates risk exposure at the individual property and location level.
For every geo-coded location across the U.S, the proprietary CoreLogic HRS is compiled using data representing nine natural hazards: flood, wildfire, tornado, storm surge, earthquake, straight-line wind, hurricane wind, hail and sinkhole.
Alaska and Hawaii were not included due to limited natural hazard risk data, CoreLogic said.
Locations with higher risk levels are exposed to multiple hazard risks and will, therefore, receive higher scores when the risk analysis is aggregated. Subsequently, locations with minimal risk levels have lower exposure and receive lower scores. Geo-coded locations are generated at the property-address level using latitude and longitude coordinates and include both residential and commercial properties.
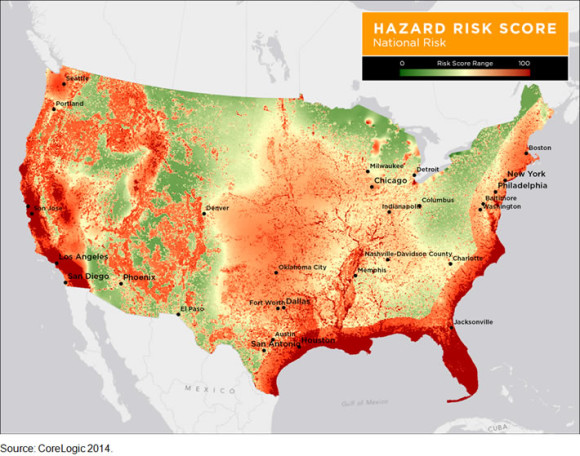
“Florida’s high level of risk is driven by the potential for hurricane winds and storm surge damage along its extensive Atlantic and Gulf coastline, as well as the added potential for sinkholes, flooding and wildfires. Michigan alternatively ranks low for most natural hazard risks, other than flooding,” said Dr. Howard Botts, vice president and chief scientist for CoreLogic Spatial Solutions.
In calculating the overall score, both the probability of an event and the frequency of past events are significant contributing factors used to determine risk levels associated with individual hazards, as well as each distinct hazard’s risk contribution to total loss. The data is combined into an aggregated, consistent and normalized value that allows statistically valid combinations to be derived.
“In the past, natural hazards have been difficult to compare and combine in a meaningful way,” said Dr. Botts. He said the new Hazard Risk Score is a “single solution” that measures risk concentration consistently and pinpoints the riskiest places in the U.S. with accuracy.
“This insight is critical in conducting comparative risk management nationwide and fully understanding exposure to potential natural hazard damage,” he said.
CoreLogic says the score can be used to improve decision-making in a variety of business operations, including:
- Business continuity and disaster recovery planning
- Analyzing risk associated with a residential property or portfolios of properties
- Measuring mitigation savings vs. total hazard potential damage
- Evaluating and determining natural hazard risk levels of distribution and supplier networks
- Recognizing which underinsured or uninsured properties may become at risk of default
- Adverse selection avoidance and identification of “good risk” properties
U.S. Natural Hazard Risk by State* (Ranked by CoreLogic Hazard Risk Score)
| Rank | State | HRS |
| 1 | FL | 94.51 |
| 2 | RI | 79.67 |
| 3 | LA | 79.23 |
| 4 | CA | 75.56 |
| 5 | MA | 72.12 |
| 6 | KS | 69.51 |
| 7 | CT | 69.04 |
| 8 | OK | 66.82 |
| 9 | SC | 66.38 |
| 10 | DE | 65.38 |
| 11 | OR | 64.89 |
| 12 | NJ | 61.54 |
| 13 | IA | 61.02 |
| 14 | TX | 60.89 |
| 15 | NC | 59.72 |
| 16 | MO | 57.81 |
| 17 | DC | 57.33 |
| 18 | MS | 57.05 |
| 19 | AR | 56.7 |
| 20 | NH | 55.3 |
| 21 | ID | 52.75 |
| 22 | MD | 52.28 |
| 23 | CO | 51.88 |
| 24 | NE | 51.86 |
| 25 | IL | 51.8 |
| 26 | IN | 50.74 |
| 27 | GA | 50.58 |
| 28 | NV | 50.12 |
| 29 | AL | 49.42 |
| 30 | KY | 47.34 |
| 31 | TN | 46.48 |
| 32 | UT | 45.22 |
| 33 | NM | 43.76 |
| 34 | AZ | 42.81 |
| 35 | VA | 42.35 |
| 36 | WA | 42.3 |
| 37 | WI | 38.52 |
| 38 | SD | 38.24 |
| 39 | MT | 37.91 |
| 40 | MN | 36.42 |
| 41 | OH | 34.61 |
| 42 | ME | 31.64 |
| 43 | WY | 30.24 |
| 44 | PA | 28.79 |
| 45 | VT | 28.31 |
| 46 | ND | 27.5 |
| 47 | NY | 24.97 |
| 48 | WV | 20.67 |
| 49 | MI | 20.22 |
Source: CoreLogic 2014
* AK and HI were excluded in the ranking due to limited natural hazard risk data
Source: CoreLogic 2014
Topics USA
Was this article valuable?
Here are more articles you may enjoy.
 Florida Property Tax Cut Plan Relies on Population Boom That Has Slowed Dramatically
  Clash of Florida Titans Pits Powerful Tribe Against Homebuilder Lennar
  El Niño Likely Strongest in 75 Years, US Forecasters Say
  Ranking: Who Are the Insurance Industry’s AI Talent, Maturity Leaders?