

Workers’ compensation insurers reported a 5.3 percent increase in direct written premiums during the first six months of 2015 versus the same period in 2014, according to actuarial firm Demotech’s review of second quarter 2015 data.
Demotech analyzed data reported by insurers to the National Association of Insurance Commissioners.
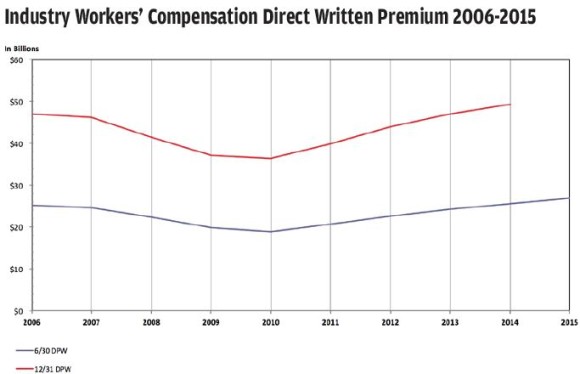
Workers’ compensation direct written premiums have now increased for five straight years. This growth has been driven mainly by rate increases and other insurer pricing actions in addition to moderate payroll growth. Written premiums at mid-year 2015 of $26.9 billion are at an all-time high and are a significant increase from the mid-year 2010 low of $18.8 billion.
Top 25 Writers
The top 25 workers’ compensation insurers, ranked by the highest dollar amount of direct written premium growth, reported a 23.2 percent increase during the first six months of 2015 versus the same period in 2014. This increase is impressive since 10 of the insurers in this year’s top 25 group were also in last year’s top 25 group. For all other workers’ compensation insurers combined, reported premium decreased by 0.1 percent.
AmTrust Group continues to grow, with four of its insurers in the top 25 group. These same insurers were in last year’s top 25 group. In a recent conference call, AmTrust attributed its growth to successfully targeting small businesses in key states and to rate increases.
Berkshire Hathaway also has four insurers in the top 25 group. None of these were in last year’s top 25 group. Berkshire Hathaway recently acquired several of these insurers and has targeted growth in workers’ compensation and other commercial lines of business.
Texas Mutual Insurance Co. has been in the top 25 group for five consecutive years.
Five of the top 25 insurers wrote more than 80 percent of their total workers’ compensation premium in California: Insurance Co. of the West, Security National Insurance Co., Fire and Casualty Insurance Co., Republic Underwriters Insurance Co. and Torus National Insurance Co. However, the Workers Compensation Insurance Rating Bureau of California recommended a 10 percent reduction in advisory pure premium rates effective July 1, 2015, mainly due to cost savings from reforms effective in 2013 and better than expected payroll growth. Although insurers do not have to adopt this recommendation, there may be a leveling off or reversal of the industry premium growth observed in California since 2009.
Most of the other top 25 insurers are members of large national and international insurance groups. Some of the growth reported by these insurers may be associated with renewals of business formerly written by other companies within the group. For instance, Torus National Insurance Co., which is a member of Enstar Group, is renewing select business previously written by a company recently acquired by Enstar.
Medical costs continue to represent a majority of workers’ compensation losses. The impact of the Affordable Care Act on future healthcare system costs remains uncertain. Escalating prescription drug costs and aging of the workforce may result in new or increased claim costs. Concurrently, interest rates continue to be at historically low levels; investments are generating less investment income which might help to offset these claim cost increases. Therefore insurers must continue to focus on underwriting profitability for this line of business.
Premium is often described as the trading of a small certain loss for a large uncertain loss. For workers’ comp, there is great uncertainty since this loss is often paid out over many years. It may be decades before we can tell whether these top 25 insurers grew profits as well as premiums.
Top 25 Workers’ Comp Direct Written Premium Growth – Second Quarter Update |
||||||
| Rank | Company | Group Name | Year to Date 6/30/2015 |
Year to Date 6/30/2014 |
Growth | % Change |
| 1 | Wesco Insurance Co. | AmTrust Group | $360,226,399 | $258,529,368 | $101,697,031 | 39.3% |
| 2 | Employers Preferred Insurance Co. | Employers Insurance Group | $206,661,061 | $107,590,831 | $99,070,230 | 92.1% |
| 3 | Insurance Co. of the West | ICW Group | $394,276,380 | $310,552,786 | $83,723,594 | 27.0% |
| 4 | Security National Insurance Co. | AmTrust Group | $331,953,295 | $251,561,312 | $80,391,983 | 32.0% |
| 5 | Travelers Property Casualty Co. of America | Travelers Group | $861,609,415 | $784,855,031 | $76,754,384 | 9.8% |
| 6 | Starr Indemnity & Liability Co. | Starr Group | $164,945,575 | $89,743,465 | $75,202,110 | 83.8% |
| 7 | Zurich American Insurance Co. | Zurich Insurance Group | $920,157,132 | $848,620,832 | $71,536,300 | 8.4% |
| 8 | National Union Fire Insurance Co. | American International Group | $286,911,147 | $218,030,812 | $68,880,335 | 31.6% |
| 9 | Redwood Fire & Casualty Insurance Co. | Berkshire Hathaway Group | $80,742,971 | $17,888,095 | $62,854,876 | 351.4% |
| 10 | Berk Hathaway Homestate Insurance Co. | Berkshire Hathaway Group | $160,876,665 | $101,126,559 | $59,750,106 | 59.1% |
| 11 | Employers Assurance Co. | Employers Insurance Group | $123,577,451 | $64,342,545 | $59,234,906 | 92.1% |
| 12 | Insurance Co. of the State of PA | American International Group | $304,084,362 | $252,244,461 | $51,839,901 | 20.6% |
| 13 | Technology Insurance Co. | AmTrust Group | $502,774,195 | $453,074,171 | $49,700,024 | 11.0% |
| 14 | United Wisconsin Insurance Co. | BCBS of MI Group | $117,894,990 | $71,085,061 | $46,809,929 | 65.9% |
| 15 | Republic Underwriters Insurance Co. | Delek Group | $104,830,700 | $62,056,782 | $42,773,918 | 68.9% |
| 16 | Old Republic Insurance Co. | Old Republic Group | $282,824,159 | $242,317,133 | $40,507,026 | 16.7% |
| 17 | NorGUARD Insurance Co. | Berkshire Hathaway Group | $189,993,874 | $150,398,968 | $39,594,906 | 26.3% |
| 18 | Liberty Insurance Corp. | Liberty Mutual Group | $313,014,870 | $275,778,319 | $37,236,551 | 13.5% |
| 19 | American Zurich Insurance Co. | Zurich Insurance Group | $540,820,137 | $507,721,051 | $33,099,086 | 6.5% |
| 20 | Rochdale Insurance Co. | AmTrust Group | $167,713,684 | $136,039,572 | $31,674,112 | 23.3% |
| 21 | Torus National Insurance Co. | Enstar Group | $45,536,502 | $14,068,742 | $31,467,760 | 223.7% |
| 22 | New York Marine & General Insurance Co. | NY Marine & General Group | $70,461,458 | $40,431,637 | $30,029,821 | 74.3% |
| 23 | Ohio Security Insurance Co. | Liberty Mutual Group | $63,345,165 | $33,733,470 | $29,611,695 | 87.8% |
| 24 | National Liability & Fire Insurance Co. | Berkshire Hathaway Group | $34,417,902 | $4,893,223 | $29,524,679 | 603.4% |
| 25 | Texas Mutual Insurance Co. | N/A | $584,190,100 | $556,713,562 | $27,476,538 | 4.9% |
| Data Source: The National Association of Insuranceurance Commissioners (NAIC), Kansas City, Mo., by permission. | ||||||
| Information derived from an SNL Financial product. The NAIC and SNL Financial do not endorse any analysis or conclusion based upon the use of this data. | ||||||
| This exhibit is based upon the initial reporting of second quarter 2015 data, estimated to be more than 95 percent of the companies that report quarterly. | ||||||
| It excludes several large state funds (e.g. California, New York, Pennsylvania) which have not always reported second quarter data. | ||||||
Topics Trends California Carriers Talent Workers' Compensation Pricing Trends
Was this article valuable?
Here are more articles you may enjoy.
 Florida Property Tax Cut Plan Relies on Population Boom That Has Slowed Dramatically
  US P/C Industry Books Best Result in a Decade but Not All Lines Enjoy Success
  Honda’s Insurance Agency Operations Stall, Services ‘Paused’