
Americans are still buying homes in areas with high risk of natural hazards and the homes in those cities continue to appreciate in value far faster than homes in low natural hazard locales.
However, the effect on home values of living in a high risk area is being felt in two high risk states — Florida and Louisiana— where home values are not rising as fast as in lower risk cities.
The 2017 U.S. Natural Hazard Housing Risk Index by the property analytics firm ATTOM Data Solutions found that median home prices in U.S. cities in the top 20 percent of highest risk for natural hazards have increased more than twice as fast over the past five years and over the past 10 years than median home prices in U.S cities in the bottom 20 percent with lowest risk.
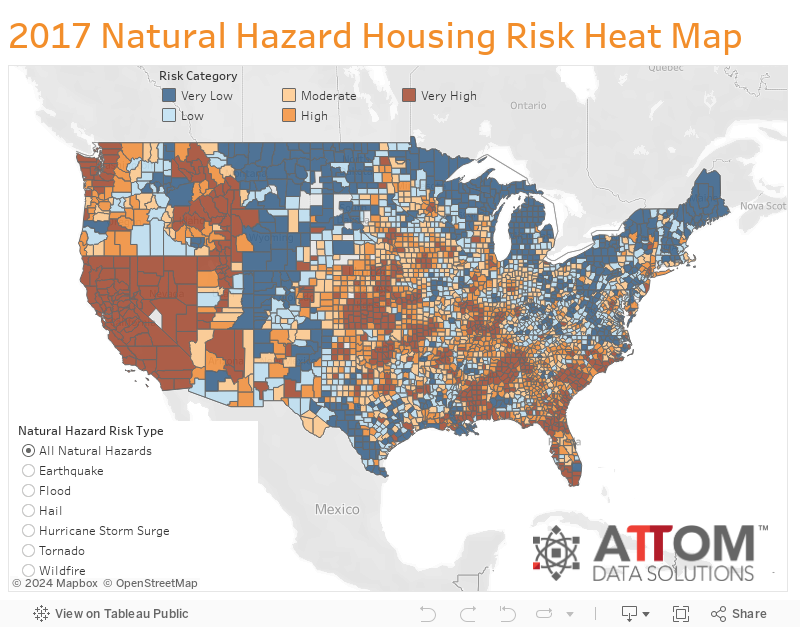
For the report ATTOM indexed natural hazard risk in more than 3,000 counties and more than 22,000 U.S. cities based on the risk of six natural disasters: earthquakes, floods, hail, hurricane storm surge, tornadoes, and wildfires. ATTOM also analyzed housing trends in 3,441 cities and 735 counties — containing more than 71 million single family homes and condos — broken into five equal quintiles of natural hazard housing risk (see full methodology below).
Median home prices in cities in the top 20 percent (Very High) for natural hazard risk have appreciated 65 percent on average over the past five years and 9 percent on average over the past 10 years while median home prices cities in the bottom 20 percent (Very Low) for natural hazard risk have appreciated 32 percent on average over the past five years and 3 percent on average over the past 10 years.
“Strong demand for homes in high-risk natural hazard areas has helped to accelerate price appreciation in those areas over the past decade despite the potential for devastating damage to homes that can be caused by a natural disaster — as evidenced by the recent hurricanes that made landfall in Texas and Florida,” said Daren Blomquist, senior vice president at ATTOM Data Solutions. “That strong demand is driven largely by economic fundamentals, primarily the presence of good-paying jobs, although the natural beauty that often comes hand-in-hand with high natural hazard risk in these areas is also attractive to many homebuyers.”
However, the home values trend does not hold up in two states areas that have been hit hard by storms and flooding as well as rising flood insurance prices.
“There is some evidence in the data that real estate consumers in certain areas are beginning to more heavily factor natural hazard risk into their decisions, particularly when it comes to flood risk,” Blomquist added. “Counter to the national trend, home price appreciation is slower in Florida and Louisiana cities with the highest flood risk than in cities with the lowest flood risk.”
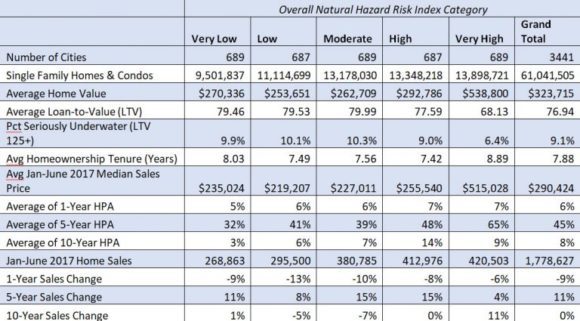
In the state of Florida, median home prices in cities with the highest flood risk were up 8 percent on average from a year ago and up 66 percent from five years ago while median prices in cities with the lowest flood risk were up 10 percent from a year ago and 70 percent from five years ago.
Median home prices in Florida cities with the highest hurricane storm surge risk were up 8 percent from a year ago and 47 percent from five years ago, while median prices in cities with the lowest hurricane storm surge risk were up 11 percent from a year ago and up 67 percent from five years ago.
There was a similar trend in relation to flood risk in the state of Louisiana, which experienced damaging floods in August 2016. Median home prices in Louisiana cities with the highest flood risk were down 20 percent from a year ago and up 2 percent from five years ago while median home prices in the lowest risk cities increased 5 percent over the past year and increased 37 percent over the past five years.
Home Equity
Homeowners in cities in the top 20 percent for natural hazard risk have 32 percent home equity on average compared to 21 percent home equity on average for homeowners in cities in the bottom 20 percent for natural hazard risk.
Seriously underwater homes (with a loan-to-value ratio of 125 percent or higher) account for 6.4 percent of all homes in cities in the top 20 percent for natural hazard risk compared to a seriously underwater rate of 9.9 percent on average for homes in cities in the bottom 20 percent for natural hazard risk.
Highest Hazard Risk Cities and Counties
According to ATTOM Data’s 2017 U.S. Natural Hazard Housing Risk Index, among the 735 U.S. counties included in the housing trends analysis, those with the highest overall natural hazard index were Oklahoma County, Oklahoma; Wakulla County (Tallahassee), Florida; Monroe County (Key West), Florida; Cleveland County (Oklahoma City), Oklahoma; and Nevada County (Truckee), California.
Among 50 U.S. cities included in the analysis with a population of at least 500,000, those with the highest overall natural hazard housing risk index were Oklahoma City, Oklahoma; San Jose, California; Los Angeles, California; Bakersfield, California; and Seattle, Washington.
Lowest Hazard Risk Cities and Counties
Among the 735 U.S. counties included in the housing trends analysis, those with the lowest overall natural hazard index were Milwaukee County (Milwaukee), Wisconsin; Cuyahoga County (Cleveland), Ohio; Muskegon County (Muskegon), Michigan; and Lake County (Cleveland), Ohio.
Among 50 U.S. cities included in the analysis with a population of at least 500,000, those with the lowest overall natural hazard housing risk index were Philadelphia, Pennsylvania; Phoenix, Arizona; Buffalo, New York; Orlando, Florida; and Brooklyn, New York.
Index Methodology
ATTOM Data Solutions is the curator of the ATTOM Data Warehouse, a multi-sourced national property database that blends property tax, deed, mortgage, foreclosure, environmental risk, natural hazard, health hazards, neighborhood characteristics and other property characteristic data for more than 150 million U.S. residential and commercial properties.
For its fourth annual Natural Hazard Housing Risk Index, ATTOM Data Solutions indexed more than 3,000 U.S. counties and more than 22,000 U.S. cities based on risk of six natural disasters: earthquakes, floods, hail, hurricane storm surge, tornadoes and wildfires. ATTOM also analyzed home sales and price trends in 735 counties and more than 3,400 cities with sufficient property data.
A risk index was created for each of the six natural hazards in each city and count with natural hazard data available. Each natural hazard index was divided into five categories of risk: Very High, High, Moderate, Low and Very Low based on a severity scale. Those six natural hazard indexes were summed to create a Total Natural Hazard Index. The maximum index for each category of risk is 60, and the maximum possible total index score is 360.
For the home sales and price trends analysis, the indexes in 735 counties and 3,441 cities were split into five equal groups (quintiles) matching the aforementioned five categories of risk.
Flood zone data is based on flood zones created by the Federal Emergency Management Agency (FEMA), and the level of risk was based on the percentage of homes in each county located in high-risk flood zones: A, A99, AE, AH, A.
Earthquake data is from the United States Geological Survey (USGS), and the level of risk was based on the probability of a magnitude 5.0 earthquake in each county.
Tornado data is from the National Oceanic and Atmospheric Administration (NOAA), and level of risk was based on the Destruction Potential Index (DPI) for each county. DPI is calculated using number of tornados, path of tornados in square miles, and intensity of tornados on the Fujita scale (FO to F5).
Wildfire data is from the United States Department of Agriculture Forest Service and Fire Modeling Institute, and risk level is based on the percentage of homes in each county located in “Very High” or “High” Wildfire Hazard Potential (WHP) areas.
Hurricane storm surge data is from FEMA and the National Hurricane Center (NHC), and risk level is based on the percentage of homes located in flood zones identified as having a risk of “storm-induced waves”: V and VE.
Hail data is from NOAA and the risk level is based on the average number of hail storms per year in each county with hail that exceeds 1-inch in size over the past 15 years.
Source: ATTOM Data Solutions
Topics USA California Catastrophe Florida Flood Wildfire Louisiana Property Hurricane Oklahoma
Was this article valuable?
Here are more articles you may enjoy.
 Florida Property Tax Cut Plan Relies on Population Boom That Has Slowed Dramatically
  Damaged Manhattan Tower Owner to Reconstruct 15 Floors After Evacuation
  One Weather Firm Warns New England Could See Big Hurricane This Season
  Ryanair Passenger Partly Sucked From Jet After Window Breaks