
The purpose of modeling is to anticipate the likelihood and severity of catastrophes so that companies can prepare for their financial impact — before they occur.
The evidence suggests that, for the most part, modeling has achieved its mission. Eleven insurers became insolvent after Hurricane Andrew in 1992, while none faced that consequence after Hurricane Katrina’s assault on the Gulf Coast in 2005.
Still, a series of large catastrophe losses in recent years has taken some in the insurance industry by surprise. One reason is that these large losses arose from so-called “non-peak” zones, including the Maule, Chile earthquake in 2010 and the New Zealand earthquakes of 2010 and 2011.
Another reason for the sense of surprise — one that has since become the subject of much discussion in the industry — was the proportion of losses that arose from non-modeled perils.
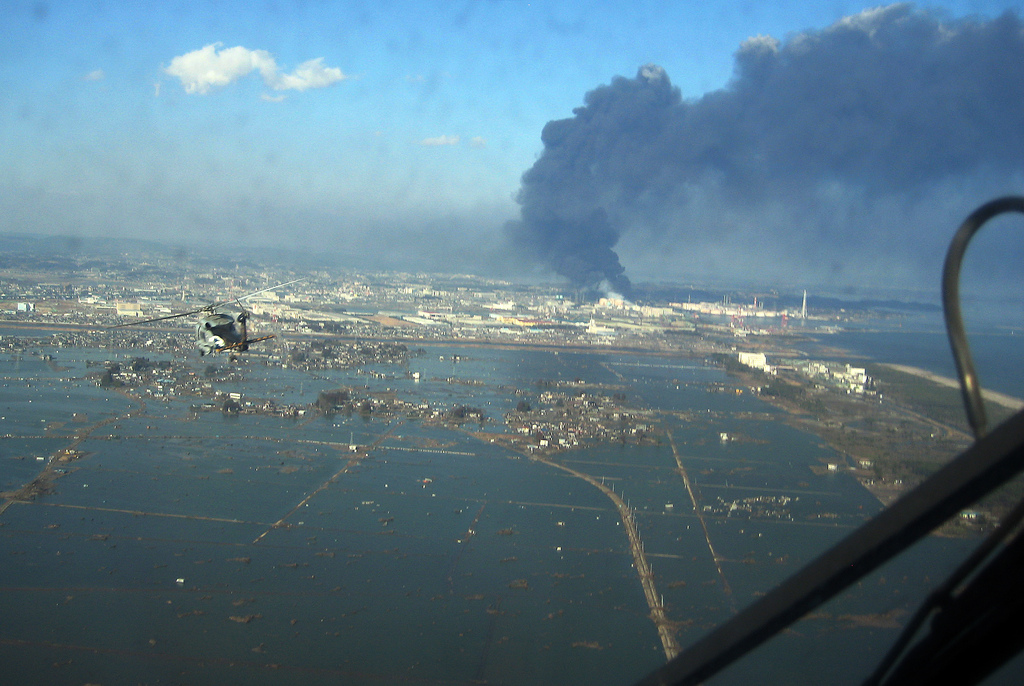
These include the tsunami that devastated large stretches of Japan’s coast in March 2011, the flooding of Bangkok later that year, and extensive liquefaction that was a significant driver of losses from the two New Zealand quakes.
The events of 2010-2011 highlight the need to make models even more comprehensive and to capture as many drivers of loss as possible.
Catastrophe modelers such as AIR are looking at ways to address these challenges — both through an aggressive research roadmap and through an innovative, recently released catastrophe modeling platform that gives companies the tools to manage accumulations for non-modeled perils and regions.
More (and More Comprehensive) Models
Over the next few years new models will be introduced that will help address the gap in model coverage and comprehensiveness.
For example, the industry’s first fully probabilistic tsunami model is scheduled for release this year as part of a comprehensive update to the AIR Earthquake Model for Japan, and several flood models are currently in development.
These are fully probabilistic models that simulate realistic and robust storm patterns over space and time, allowing companies to manage their risk from flooding both on and off the floodplain.
But detailed catastrophe models take considerable time, effort, and expertise to develop. Since the Tohoku earthquake of 2011, for example, a team of 20 AIR scientists and engineers has been working to update the Japan earthquake model to reflect the changes in seismic risk and to incorporate tsunami and liquefaction modeling capabilities.
Flood models are even more labor intensive. And it is important to note that none of it can be accomplished unless high-quality hazard data at high resolution is available.
Such data sets — which may include high resolution soil, elevation, land use/land cover, hydrologic, and precipitation data and the like — are not currently available in many regions of the world — and may not be for some time.
In the meantime, companies need simple but powerful solutions to manage accumulations of exposure for which detailed modeling is not yet available.
Sophisticated Spatial Tools for Managing Global Exposures (Modeled and Non-Modeled)
Today, catastrophe modeling is the industry standard tool for assessing and managing catastrophe risk, but companies remain hard-pressed to fully understand their loss potential from non-modeled perils and regions.
AIR’s new modeling platform, Touchstone, provides companies with tools to easily visualize and understand the relationship between exposure, hazard, and loss information, allowing them to manage their global exposures, including those in non-modeled regions.
The concentration analytics in Touchstone, for example, provides users an exposed limit for each user-specified zone — after the application of all insurance and reinsurance terms.
The interactive user interface allows companies to analyze their accumulations relative to various location characteristics or detailed hazard information.
At the portfolio level, for example, a user can overlay several geospatial layers (such as liquefaction maps, distance to coast, storm surge potential, and footprints of historical events) over their exposures. This is a quick way to evaluate the portfolio’s exposure to catastrophe hazards and determine whether accumulations fall within underwriting guidelines.
Indeed, accumulations can be viewed in a variety of ways, including:
- Zonal analysis: Specify accumulation zones by political boundaries, rings, or user-defined regions.
- Ring analysis: Quickly perform concentric ring analysis to evaluate terrorism exposure around specific targets, anywhere in the world.
- GIS Shape files: Import their own or third-party hazard layers (e.g., tsunami footprints, return period flood maps, or location data from volcano databases). Users can even import custom damage footprints and apply user-defined damage ratios to quantify the risk from non-modeled regions or perils.
Today’s companies are re-examining their portfolios with an increased focus on the impact of non-modeled perils. To serve this growing need, AIR continues to develop new models worldwide and is providing companies with the tools to identify and control exposure accumulations so they can formulate a more comprehensive view of their risk.
Topics Catastrophe Profit Loss Flood
Was this article valuable?
Here are more articles you may enjoy.
 El Niño Likely Strongest in 75 Years, US Forecasters Say
  Hellman & Friedman’s Hub International Seeks $3 Billion in IPO
  Ranking: Who Are the Insurance Industry’s AI Talent, Maturity Leaders?
  Honda’s Insurance Agency Operations Stall, Services ‘Paused’