
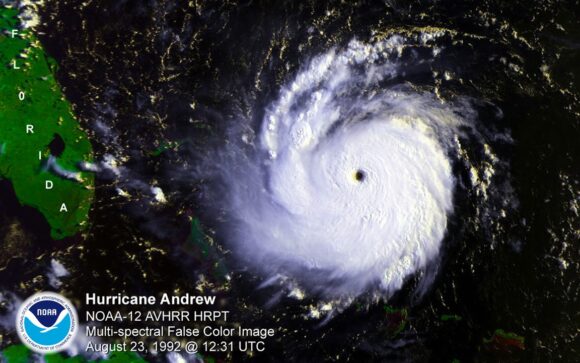
At five o’clock on the morning of August 24, 1992, Hurricane Andrew came ashore near Homestead, Florida, as a Category 5 storm. It was one of only four hurricanes known to have struck the continental United States at Category 5 intensity since 1900. Its sustained winds were originally reported at 165 miles per hour, with a later corrected peak-gust estimate of 177 mph that was recorded at a private residence before structural failure ended the observation. Its central pressure had fallen to 922 millibars. In a matter of hours it flattened neighborhoods across South Dade County, left roughly a quarter of a million people homeless, and rewrote the economics of catastrophe risk in America.
Andrew is remembered, in part, for a geographic accident. It crossed the coast about 20 miles south of downtown Miami. Twenty miles is the difference between a very expensive hurricane and an almost unthinkable one. That near miss is exactly why the storm is worth revisiting now, on its anniversary, not as history but as a live question: if Andrew came back tomorrow, on the same track, into the South Florida we have built since 1992, what would it cost? And what does the answer tell us about the exposure sitting in our portfolios today?
A storm that grew up overnight
Andrew formed from a tropical wave on August 16 and, for several days, looked unremarkable. Then it crossed unusually warm water and intensified with startling speed. Andrew first reached Category 5 on August 23, then weakened over the Bahamas, and strengthened again to a Category 5 over the Gulf Stream in the final hours before landfall. It struck Elliott Key and then Homestead as a compact but ferocious storm, driving a surge of nearly 17 feet ashore and reducing Homestead Air Force Base to rubble. Two days later, on August 26, it made a second landfall in Louisiana near Morgan City as a Category 3, with winds around 115 miles per hour.
Andrew was primarily a wind-loss event, unlike Katrina thirteen years later, whose losses were dominated by storm surge and flooding. That distinction matters for how the losses fell and for how we model the two perils today. Across its path, Andrew caused 65 deaths overall, including 23 deaths in the United States and three in the Bahamas. The toll likely would have been substantially higher had the storm crossed a more densely populated section of the coast.
The reckoning of 1992
The financial shock was without precedent. Andrew caused roughly $26.5 billion in economic damage and about $15.5 billion in insured losses, in 1992 dollars, making it by a wide margin the costliest natural disaster in American history to that point. Tens of thousands of homes were destroyed and more than 100,000 damaged.
The insurance industry was not ready. Official sources cite at least 11 insurer insolvencies, while Triple-I counts at least 16 insurer failures during 1992 and 1993. Carriers that had comfortably collected Florida premiums for years discovered that their capital, their reinsurance, and above all their assumptions were not built for a single event of this magnitude. Reinsurers absorbed heavy losses, and the market hardened sharply. Andrew did not just damage property; it exposed how little the industry actually understood about the risk it was carrying.
The storm that built an industry
Andrew is the reason catastrophe modeling went from a specialized analytical tool to an industry discipline. Before the storm, many insurers relied primarily on historical loss experience, actuarial projections, and underwriting judgment, or essentially steering by the rear-view mirror. Karen Clark, who had founded Applied Insurance Research in 1987, had been arguing that probabilistic simulation could provide a more realistic view of low-frequency, high-severity losses. Within hours of Andrew’s landfall, AIR estimated that insured losses could exceed $13 billion, far above the industry’s early mid-single-digit-billion-dollar projections. The ultimate insured loss reached approximately $15.5 billion. The boardroom question quickly changed from “Why would we pay for a model?” to “Why don’t we already have one?”
The storm also rebuilt the machinery of the Florida market. It gave rise to the Florida Hurricane Catastrophe Fund, to the residual-market mechanisms that became Citizens, and to a wave of building-code reform that eventually produced the statewide Florida Building Code. It helped launch the modern Bermuda reinsurance market as fresh capital rushed in to fill the gap. Andrew, in other words, didn’t merely cause losses, but rather changed the rules of insurance.
When I joined RMS, now part of Moody’s, as an intern in 1998, Hurricane Andrew remained the defining catastrophe event for the property insurance industry. I learned how catastrophe models represented Andrew within their historical-event and scenario sets, and how its severity had made it an industry benchmark for stress testing. The storm fundamentally reshaped how insurers and reinsurers evaluated hurricane risk, tested portfolio resilience, and measured the potential financial consequences of a major catastrophe. I was new but could see how Andrew’s lessons had significantly changed property underwriting and exposure management, only six years after landfall.
If Andrew came back tomorrow
Now run the same storm, on the same track, into today’s South Florida. The physical event is unchanged. The thing underneath it is very different. Florida’s population has grown from approximately 13.6 million in 1992 to 23.46 million in 2025, an increase of about 72%, and the growth has been heaviest exactly where Andrew struck. Miami-Dade, Broward, and Palm Beach counties now hold approximately $1.2 trillion in residential and commercial property. Construction costs, contents values, and labor prices have all climbed with it.
It is important to note that as of 2022, there had already been significant growth in exposure in Southeast Florida. Given the ongoing trend of development and asset concentration, current figures would likely be even higher.
On the same track, major catastrophe modelers now estimate a modern Andrew would produce approximately $70 to $100 billion in insured losses. RMS and Verisk estimate losses at roughly $100 billion, while Karen Clark & Company (KCC) estimates $70 billion. Beyond the same-track scenario, a counterfactual event—if Andrew had tracked 50 miles north to hit Miami directly—would result in insured losses exceeding $200 billion.
What this should change about how we underwrite?
The anniversary is only useful if it changes something. For those of us who build and use catastrophe analytics, Andrew carries four lessons that are as sharp today as they were in 1992.
First, a loss estimate is only as good as the exposure data beneath it. Andrew exposed the consequences of limited exposure visibility. In my work since then, I have continued to see portfolios containing stale values, incomplete secondary characteristics, placeholder business-interruption limits, and buildings assigned to the wrong occupancy or construction class. Any model fed bad exposure will return a confident, precise, and wrong answer. Data quality is not a back-office chore; it is the foundation of the number leadership relies on.
Second, accumulation is the silent risk. Andrew’s losses were concentrated, and the concentrations in the tri-county corridor today are larger and more correlated than most portfolios appreciate. Small, individually reasonable accounts can sum to an unmodeled peak across geography, occupancy, and policy structure.
Third, the average is not the exposure. Pricing to the mean while the tail grows is precisely how carriers went insolvent in 1992. Secondary uncertainty, demand surge, and correlation deserve as much attention as the headline expected loss.
Fourth, the model has to become a decision. A number on its own is not guidance. The work is to translate model output into underwriting appetite, portfolio limits, reinsurance structure, and a capital and earnings story that a board can actually act on. That requires catastrophe analytics to operate inside the underwriting workflow, before the risk is bound, not only in a periodic backward-facing portfolio review after the exposure has already been accepted.
The anniversary as a stress test
Andrew has not happened again in exactly this form, which makes it easy to file under history. Regardless of what the event probability would be today, the exposure beneath such a storm is unquestionably more valuable and concentrated. The discipline is to treat the anniversary as a stress test rather than a memorial, and to ask, honestly, whether today’s book could absorb the storm we already know how to describe. That question, in the end, is the whole point of the work.
Was this article valuable?
Here are more articles you may enjoy.
 Viewpoint: Beware These Commercial Auto Endorsements!
  Home Insurance Tops Property Taxes in Squeeze for US Households
  Jury Awards $6.8 Million in Nursing Home Understaffing Class Action
  AM Best: Social Inflation Drives Surge in Commercial Auto Liability Claims