
A recent analysis by S&P Global Market Intelligence reveals that the pace of growth in the U.S. excess and surplus lines market slowed to 13.4% in 2024, down from 14.5% a year earlier.
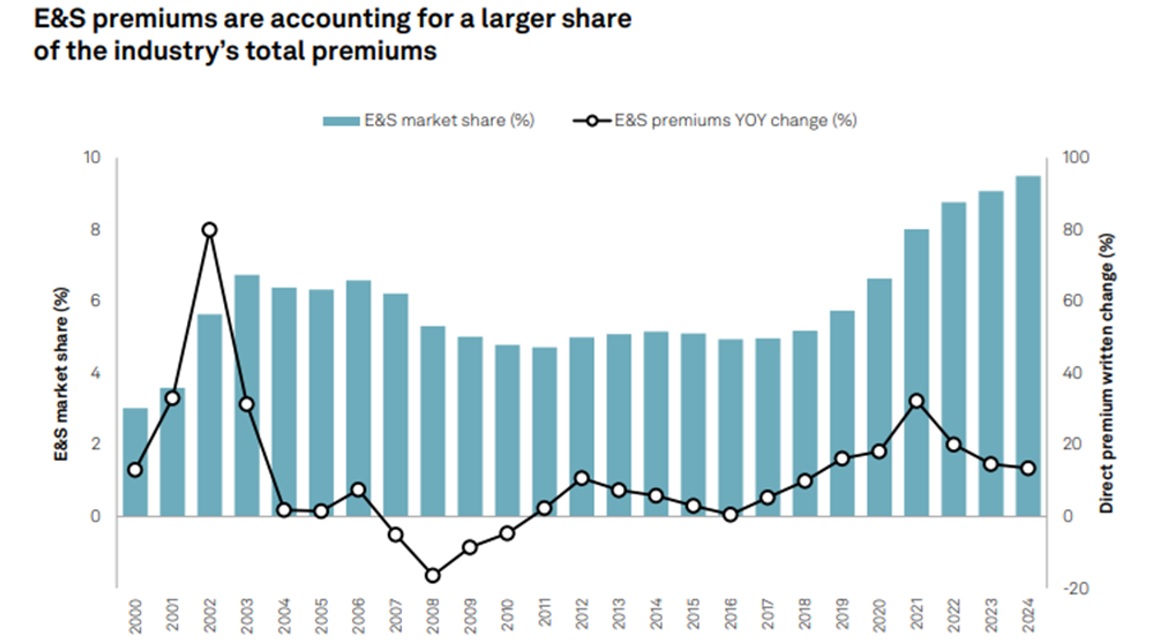
While growth stayed up in double digits in both years, the jumps paled in comparison to a 32.3% rate of growth recorded in 2021, according to the S&P GMI “2025 U.S. Excess & Surplus Market Report” published earlier this month.
“The E&S market continues to grow at a faster pace than the U.S. P/C industry as a whole, even as its pace of expansion slowed in 2024,” said Tim Zawacki, principal insurance analyst, S&P Global Market Intelligence. Earlier this year, S&P GMI reported that overall P/C premiums—across standard and E&S business—grew by 8% in 2024.
Focusing on E&S premiums, Zawacki noted that national growth in the E&S residential and commercial property lines moderated in 2024, increasing by 15.4%, compared to the over 20% year-over-year growth rates observed in each of the prior five years. “Weakness in commercial property rates in catastrophe-exposed geographies could lead to a continued slowing in the E&S market’s expansion in 2025,” Zawacki said.
In spite of the diminishing E&S growth last year, 2024 was still the sixth straight year of double-digit growth overall (across all lines), S&P GMI said in its “2025 U.S. Excess & Surplus Market report,” which also shows changes in E&S market share and growth rates for each of the last 20 years, lists the top 25 E&S writers in 2024, and delivers information on leaders (top 10) and 2024 E&S market share by line and state.
For full-year 2024, the U.S. E&S direct premiums written reached nearly $100 billion—coming in at $98.2 billion across all lines, up from $86.6 billion in 2023 and $75.5 billion in 2022. As in the prior years, the bulk of E&S premiums in 2024 were written within various liability coverages (51.3 billion, or 52.2%), several property lines of business ($31.7 billion, or 32.3%) and commercial auto ($5.7 billion, or 5.8%).
E&S premiums represented 9.5% of the U.S. total direct premiums written in 2024.
What’s Driving the Slowdown?
The line-of-business reports included in S&P GMI’s analysis reveal that the 15.4 percent jump in E&S premiums for commercial property and homeowners lines in 2024 marked the slowest pace of growth since 2018 (9.3%). In 2023, the E&S property growth rate had surged to 40.6%. In contrast, E&S liability premium growth, after slowing to 4.3% in 2023, returned to double-digit growth in 2024. The overall 2024 E&S liability growth rate was 12.4% across four lines (other liability-claims made, other liability-occurrence, medical professional and product liability)
Analyzing top players in the various lines, S&P GMI found that Berkshire Hathaway Group, the second biggest E&S property writer (behind STARR Cos.)—and the largest writer across all E&S lines—actually shrunk its E&S property premiums 1.5% to $4.0 billion across four property lines (fire, allied, commercial multi-peril/non-liability and homeowners) in 2024. Contributing to the decline, Berkshire’s E&S allied lines premiums fell by 17.1% to $1.5 billion, according to S&P GMI’s calculations. In contrast, in 2023, Berkshire’s E&S premiums for allied lines had soared by 66.4%.
Across all writers, homeowners, the smallest of the E&S property lines, saw outsized growth of 45.2% in 2024, rising to $3.2 billion from $2.2 billion in 2023. This jump was fueled by an 86% increase in California’s domestic E&S homeowners premiums, which climbed to $962.1 million.
Across all E&S property lines, geographies with significant exposures to hurricanes and wildfires reported the largest annual E&S growth rates last year, S&P GMI reported. Geographically, the S&P GMI analysis tracks the growth in each state’s share of E&S premiums relative to the total property market since 2019, finding changes of more than 10 percentage points in Hawaii, South Carolina and California.
Views of the 2025 E&S Property Market
Separately, at the S&P Global Ratings 41st Annual Insurance Conference in early June, specialty insurers writing commercial property on E&S paper discussed 2025 changes in the market, and their appetites for E&S commercial property risks.
Marc Adee, chair and chief executive officer of Crum & Forster Holdings Corp., highlighted recent market movement toward shared and layered business, which he said generally has broader terms and tends to be cheaper. The push to write this business occurred even after the January 2025 fires in California had “put a fair dent” in a lot of carriers’ results— when “a subdued approach to the market” would have been anticipated.
“The speed with which that market moved down might indicate that maybe some of the people that were moving the capacity from homeowners found something they liked better on the commercial lines side.”
“But that market moved hard and fast—and in a strange way,” he suggested, later encouraging investors and analysts at the conference to weigh what risk models are showing against how the market is moving. “The different versions of the models keep creeping up the return periods.” While modeled expected losses are trending in the upward direction, commercial property rates are going down.
“I would suggest that doesn’t make a lot of sense other than just there’s a lot of capital chasing, and not as much business as [carriers] might want.”
Related article: How Competitive Is E&S Property? Exec Views Vary
“It’s just an interesting moment on the commercial property side—[and it’s] a little bit of a head-scratcher why people find that as attractive as they do at the moment.”
C&F, he said, “dialed back a lot on property just within the last quarter,” adding that E&S companies can “turn on a dime.”
Carl Lindner III, co-chief executive officer of American Financial Group, reported that AFG writes a broad range of property in different parts of its specialty businesses. “I think overall after quite a few years of increases that our property books are pretty adequate. We’re still getting price increases that exceed loss ratio trends on a good number of those businesses. [But] there are some businesses, on the E&S side, where prices are more flat.”
“As much as anything, we’re trying to get the proper insurance-to-value where we can. That really adds to the profitability of property lines.”
Lindner continued: “We’re not a homeowners writer, and traditionally we’ve had lower relative catastrophe volatility on the hurricane and earthquake side than our peers.”
“I’m a Christian and if you think God can do whatever he wants wherever he wants with whatever frequency, we think it’s hard to really adequately price coastal property and things like earthquake,” he said, reporting that AFG’s 1-in-500-year exposure in to hurricane and earthquake is roughly 2 percent of equity.
“We’re not as regulated and I think we can pick and choose how we want to write property.
While AFG will write coastal and earthquake, the choice to write that property business might be made when it’s part of a larger book of business, he indicated.
Back to the 2024 Leaderboards
Both AFG’s P/C insurance subsidiary, Great American Insurance Group, and Fairfax Financial Group, which includes C&F, were among the top writers of E&S business across all lines in 2024, according to S&P GMI, although neither showed up among the top 10 for any of the property lines analyzed. Both groups grew overall direct E&S written premiums by about 9 percent last year. Great American ranked No. 22 in overall E&S premiums with about $1.4 billion reported for the year. Fairfax, which includes Allied World and Odyssey Re’s Hudson in addition to the C&F companies, ranked third with $4.4 billion.
Ranking above Fairfax are Berkshire and AIG, with $8.5 billion and $5.6 billion in 2024 direct E&S premiums, respectively.
(Editor’s Note: S&P GMI’s U.S. E&S ranking does not include Lloyd’s.)
Among growing E&S writers, Berkshire recorded the lowest overall growth rate at 0.8 percent last year, while two top 25 E&S insurers—Munich Re and Zurich—each reported E&S premium drops. The declines pushed each down six spots in the rankings, with Munich falling to 20th place and Zurich to 23rd.
Retaining its second place spot on the overall ranking (and a lead rank in product liability), AIG saw its 2024 E&S premium leap nearly 13 percent in 2024, following a 9 percent jump in 2023.
In terms of overall E&S growth, the biggest sprinters in 2024 were The Hartford and Chubb, each growing around 20 percent, followed by Kinsale, Travelers and W.R. Berkley.
W.R. Berkley, with $3.8 billion of its $4.2 billion 2024 E&S direct written premiums coming from the four liability lines analyzed by S&P GMI, became the largest E&S liability writer, surpassing Berkshire, the report notes.
Combining growth rates from the latest S&P GMI analysis of E&S leaders with those in a report published last year at the same time (based on 2023 writings), Carrier Management finds that the groups with the biggest overall growth rates across the two-year period were Starstone, Travelers, Kinsale, Starr Cos., and AXIS.
S&P GMI’s Methodology
The S&P GMI E&S report is derived from data running the S&P Global Market Intelligence E&S market share templates, P&C – Market Share (All exhibits) and P&C – Market Share (E&S Lines), the report notes in an introduction explaining the methodology.
Template results are based on U.S.-domiciled entities that submit regulatory statements to the National Association of Insurance Commissioners and excludes so-called alien surplus lines insurers that are domiciled outside the U.S. but write domestic business, including certain Lloyd’s of London syndicates.
According to S&P GMI, the data is derived from Schedule T of annual and quarterly statutory statements for individual entities to identify those companies that list their status as “not licensed,” “eligible surplus lines” or “domestic surplus lines insurer.”
The data was compiled on April 17, 2025.
Topics USA Trends Excess Surplus Pricing Trends AIG
Was this article valuable?
Here are more articles you may enjoy.
 Farmers to Pay $2.8M to Settle TPCA Class Action Lawsuit
  NYC to Publicly Identify Buildings Testing Positive for Legionnaires’ Bacteria
  What 124 Future Business Leaders Really Think About AI and Work